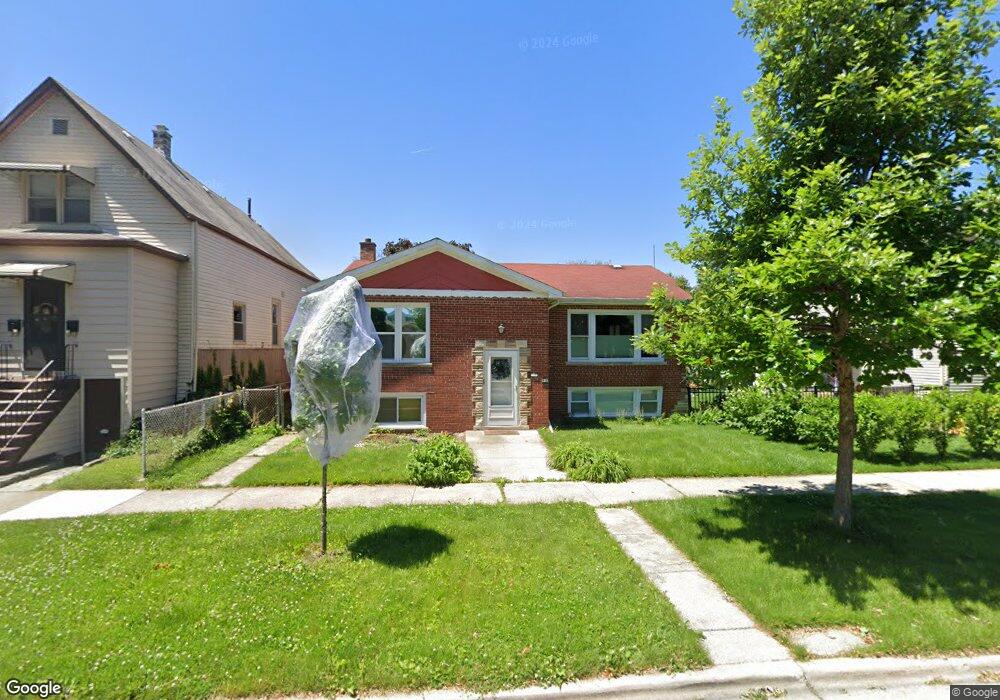
1311 Elgin Ave Forest Park, IL 60130
Estimated Value: $296,000 - $339,000
3
Beds
1
Bath
1,155
Sq Ft
$280/Sq Ft
Est. Value
About This Home
This home is located at 1311 Elgin Ave, Forest Park, IL 60130 and is currently estimated at $323,765, approximately $280 per square foot. 1311 Elgin Ave is a home located in Cook County with nearby schools including Garfield Elementary School, Betsy Ross Elementary School, and Field Stevenson Elementary School.
Ownership History
Date
Name
Owned For
Owner Type
Purchase Details
Closed on
Dec 1, 2017
Sold by
Hamilton Naomi and Cox Deborah
Bought by
Ledezma Ismael
Current Estimated Value
Home Financials for this Owner
Home Financials are based on the most recent Mortgage that was taken out on this home.
Original Mortgage
$223,870
Outstanding Balance
$188,976
Interest Rate
4.4%
Mortgage Type
FHA
Estimated Equity
$134,789
Purchase Details
Closed on
Feb 3, 1999
Sold by
Ali Sharon
Bought by
Hamilton Naomi and Cox Deborah
Home Financials for this Owner
Home Financials are based on the most recent Mortgage that was taken out on this home.
Original Mortgage
$136,000
Interest Rate
6.5%
Purchase Details
Closed on
Dec 29, 1993
Sold by
Kubnick Dane G and Kubnick Claudia K
Bought by
Ali Sharon
Home Financials for this Owner
Home Financials are based on the most recent Mortgage that was taken out on this home.
Original Mortgage
$118,400
Interest Rate
7.26%
Create a Home Valuation Report for This Property
The Home Valuation Report is an in-depth analysis detailing your home's value as well as a comparison with similar homes in the area
Home Values in the Area
Average Home Value in this Area
Purchase History
| Date | Buyer | Sale Price | Title Company |
|---|---|---|---|
| Ledezma Ismael | $228,000 | Prairie Title | |
| Hamilton Naomi | $170,000 | -- | |
| Ali Sharon | $98,666 | -- |
Source: Public Records
Mortgage History
| Date | Status | Borrower | Loan Amount |
|---|---|---|---|
| Open | Ledezma Ismael | $223,870 | |
| Previous Owner | Hamilton Naomi | $136,000 | |
| Previous Owner | Ali Sharon | $118,400 |
Source: Public Records
Tax History
| Year | Tax Paid | Tax Assessment Tax Assessment Total Assessment is a certain percentage of the fair market value that is determined by local assessors to be the total taxable value of land and additions on the property. | Land | Improvement |
|---|---|---|---|---|
| 2025 | $7,114 | $27,000 | $4,406 | $22,594 |
| 2024 | $7,114 | $27,000 | $4,406 | $22,594 |
| 2023 | $7,867 | $27,000 | $4,406 | $22,594 |
| 2022 | $7,867 | $25,372 | $3,378 | $21,994 |
| 2021 | $7,504 | $25,371 | $3,378 | $21,993 |
| 2020 | $7,388 | $25,371 | $3,378 | $21,993 |
| 2019 | $5,625 | $19,404 | $3,084 | $16,320 |
| 2018 | $5,507 | $19,404 | $3,084 | $16,320 |
| 2017 | $6,544 | $19,404 | $3,084 | $16,320 |
| 2016 | $4,329 | $16,361 | $2,790 | $13,571 |
| 2015 | $5,771 | $16,361 | $2,790 | $13,571 |
| 2014 | $2,574 | $18,359 | $2,790 | $15,569 |
| 2013 | $2,462 | $22,747 | $2,790 | $19,957 |
Source: Public Records
Map
Nearby Homes
- 1223 Elgin Ave Unit G1
- 1404 Elgin Ave
- 1227 S Harlem Ave Unit 512
- 1501 Elgin Ave
- 1101 Harlem Ave Unit 203
- 1042 Circle Ave
- 1324 Clinton Ave
- 1531 Wenonah Ave
- 1151 Home Ave
- 1032 S Maple Ave
- 1143 Clinton Ave
- 1513 Clinton Ave
- 914 Hannah Ave
- 1626 Home Ave
- 922 Beloit Ave
- 1536 Kenilworth Ave
- 839 S Harlem Ave
- 1435 Grove Ave
- 836 Circle Ave
- 1647 Clinton Ave
- 1315 Elgin Ave
- 1307 Elgin Ave
- 1305 Elgin Ave
- 1319 Elgin Ave
- 1308 Marengo Ave
- 1310 Marengo Ave
- 1312 Marengo Ave
- 1301 Elgin Ave
- 1314 Marengo Ave
- 1306 Marengo Ave
- 1318 Marengo Ave
- 1302 Marengo Ave
- 1320 Marengo Ave
- 1325 Elgin Ave Unit 2F
- 1325 Elgin Ave Unit 1F
- 1325 Elgin Ave Unit 2R
- 1310 Elgin Ave
- 7240 13th St
- 1314 Elgin Ave
- 1306 Elgin Ave
Your Personal Tour Guide
Ask me questions while you tour the home.