Estimated Value: $544,000 - $622,000
4
Beds
4
Baths
3,203
Sq Ft
$178/Sq Ft
Est. Value
About This Home
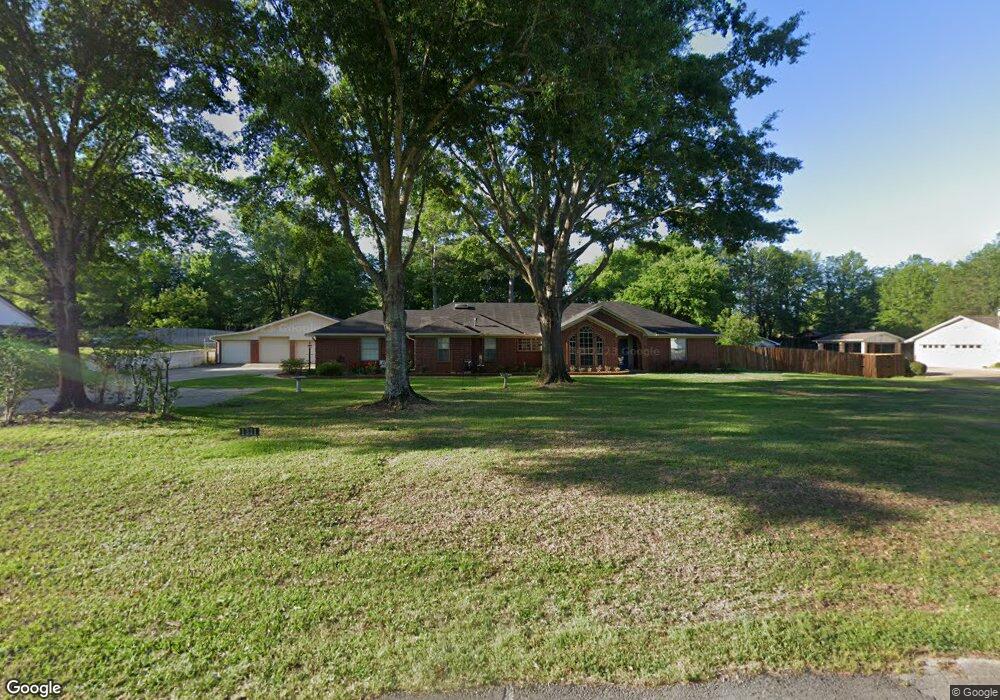
This home is located at 1311 Jeb Stuart Dr, Tyler, TX 75703 and is currently estimated at $569,002, approximately $177 per square foot. 1311 Jeb Stuart Dr is a home located in Smith County with nearby schools including Mozelle Brown Elementary School, J.W. Holloway Sixth Grade School, and Whitehouse High School.
Ownership History
Date
Name
Owned For
Owner Type
Purchase Details
Closed on
Apr 25, 2017
Sold by
Finley Michale L and Davis Kristen D
Bought by
Davis Marshall K and Davis Jennifer D
Current Estimated Value
Home Financials for this Owner
Home Financials are based on the most recent Mortgage that was taken out on this home.
Original Mortgage
$319,000
Outstanding Balance
$163,595
Interest Rate
4.3%
Mortgage Type
New Conventional
Estimated Equity
$405,407
Purchase Details
Closed on
Jul 19, 2016
Sold by
Ackerly Paul
Bought by
Finley Michael L and Finley Kristen N
Home Financials for this Owner
Home Financials are based on the most recent Mortgage that was taken out on this home.
Original Mortgage
$75,000
Interest Rate
3.6%
Purchase Details
Closed on
May 24, 2006
Sold by
Davis Lowell and Davis Karla
Bought by
Ackerly Paul
Home Financials for this Owner
Home Financials are based on the most recent Mortgage that was taken out on this home.
Original Mortgage
$60,000
Interest Rate
6.56%
Mortgage Type
Stand Alone Second
Create a Home Valuation Report for This Property
The Home Valuation Report is an in-depth analysis detailing your home's value as well as a comparison with similar homes in the area
Home Values in the Area
Average Home Value in this Area
Purchase History
| Date | Buyer | Sale Price | Title Company |
|---|---|---|---|
| Davis Marshall K | -- | None Available | |
| Finley Michael L | -- | None Available | |
| Ackerly Paul | -- | None Available |
Source: Public Records
Mortgage History
| Date | Status | Borrower | Loan Amount |
|---|---|---|---|
| Open | Davis Marshall K | $319,000 | |
| Closed | Finley Michael L | $75,000 | |
| Previous Owner | Ackerly Paul | $60,000 | |
| Previous Owner | Ackerly Paul | $240,000 |
Source: Public Records
Tax History Compared to Growth
Tax History
| Year | Tax Paid | Tax Assessment Tax Assessment Total Assessment is a certain percentage of the fair market value that is determined by local assessors to be the total taxable value of land and additions on the property. | Land | Improvement |
|---|---|---|---|---|
| 2025 | $6,170 | $642,818 | $159,441 | $483,377 |
| 2024 | $6,170 | $472,359 | $46,568 | $489,611 |
| 2023 | $6,537 | $492,922 | $46,568 | $446,354 |
| 2022 | $6,810 | $392,220 | $28,874 | $363,346 |
| 2021 | $6,631 | $354,890 | $28,874 | $326,016 |
| 2020 | $7,064 | $366,014 | $28,874 | $337,140 |
| 2019 | $6,686 | $335,180 | $22,558 | $312,622 |
| 2018 | $6,504 | $327,997 | $22,558 | $305,439 |
| 2017 | $5,490 | $313,175 | $18,046 | $295,129 |
| 2016 | $5,229 | $298,263 | $18,046 | $280,217 |
| 2015 | $4,714 | $290,867 | $18,046 | $272,821 |
| 2014 | $4,714 | $284,311 | $18,046 | $266,265 |
Source: Public Records
Map
Nearby Homes
- 1302 Jeff Davis Dr
- 1302 Jeb Stuart Dr
- 915 Pam Dr
- 903 Joel Dr
- 821 Pam Dr
- 801 Beth Dr
- 8307 Garrett Dr
- 8301 Paluxy Dr
- 815 E Grande Blvd
- 8329 Paluxy Dr
- 6522 Emory Ct
- 759 Hampton Hill Dr
- 708 Oxford Cir
- 719 Cambridge Bend Cir
- 700 Oxford Dr
- 526 Ronnette Dr
- 619 Wellington St
- 6828 Mandy Ln
- 6102 Wilderness Rd
- 604 Wellington St
- 1311 1311 Jeb Stuart
- 1315 Jeb Stuart Dr
- 1305 Jeb Stuart Dr
- 1312 Jeb Stuart Dr
- 1306 1306 Jeb Stuart
- 1322 Jeb Stuart Dr
- 1321 Jeb Stuart Dr
- 1310 Jeff Davis Dr
- 1306 Jeb Stuart Dr
- 1318 Jeff Davis Dr
- 1318 1318 Jeff Davis
- 1302 1302 Jeff Davis Dr
- 1234 Jeb Stuart Dr
- 1230 Jeb Stuart Dr
- 1407 1407 Jeb Stuart
- 1407 Jeb Stuart Dr
- 1406 Jeff Davis Dr
- 1406 1406 Jeff Davis
- 1414 Jeb Stuart Dr
- 1222 Jeff Davis Dr