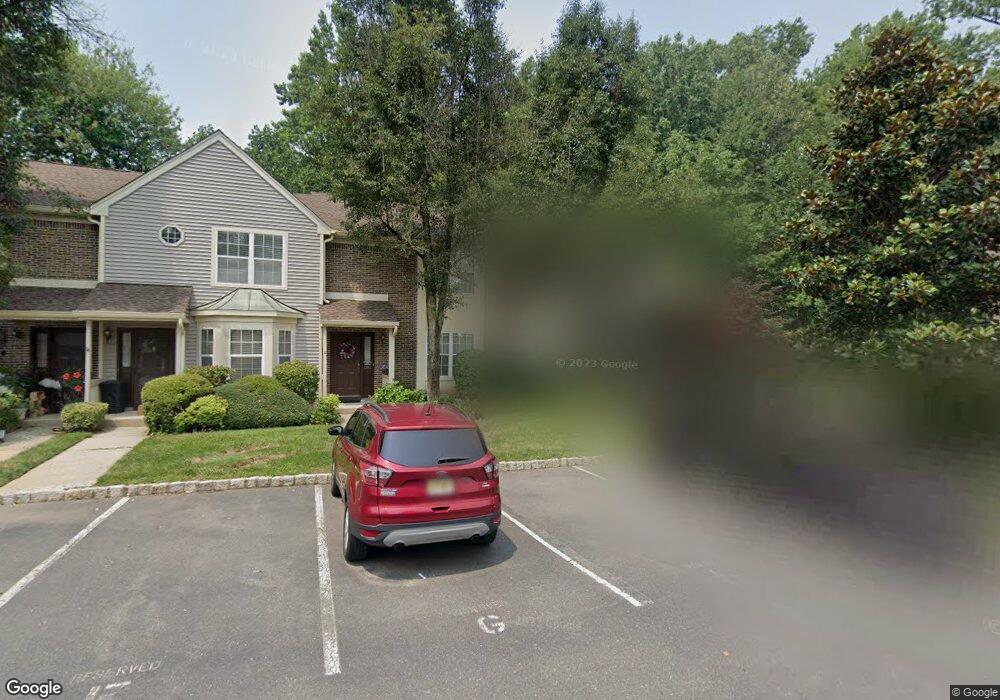
1311 Juniper Ct Monmouth Junction, NJ 08852
Estimated Value: $456,888 - $523,000
2
Beds
3
Baths
1,398
Sq Ft
$344/Sq Ft
Est. Value
About This Home
This home is located at 1311 Juniper Ct, Monmouth Junction, NJ 08852 and is currently estimated at $480,972, approximately $344 per square foot. 1311 Juniper Ct is a home located in Middlesex County with nearby schools including Brooks Crossing Elementary School, Crossroads North Middle School, and South Brunswick High School.
Ownership History
Date
Name
Owned For
Owner Type
Purchase Details
Closed on
Dec 7, 2022
Sold by
Oliiarnik Tamara
Bought by
Konstankevich Igor
Current Estimated Value
Purchase Details
Closed on
Apr 20, 2020
Sold by
Barish Erin K and Mecca Erin K
Bought by
Konstankevich Igor and Tamara Oliiarnik
Home Financials for this Owner
Home Financials are based on the most recent Mortgage that was taken out on this home.
Original Mortgage
$234,500
Interest Rate
3.6%
Mortgage Type
New Conventional
Purchase Details
Closed on
Sep 26, 2014
Sold by
Mecca Donato D
Bought by
Mecca Erin K
Purchase Details
Closed on
Oct 2, 2007
Sold by
Bloom Taubenslag Michelle and Bloom Michelle
Bought by
Mecca Erin
Purchase Details
Closed on
Aug 5, 2004
Sold by
Fox John
Bought by
Donato Mecca
Home Financials for this Owner
Home Financials are based on the most recent Mortgage that was taken out on this home.
Original Mortgage
$205,120
Interest Rate
6.16%
Create a Home Valuation Report for This Property
The Home Valuation Report is an in-depth analysis detailing your home's value as well as a comparison with similar homes in the area
Home Values in the Area
Average Home Value in this Area
Purchase History
| Date | Buyer | Sale Price | Title Company |
|---|---|---|---|
| Konstankevich Igor | $107,259 | None Listed On Document | |
| Konstankevich Igor | $276,000 | Green Label Title | |
| Mecca Erin K | -- | None Available | |
| Mecca Erin | $17,500 | None Available | |
| Mecca Donato D | -- | Old Republic National Title | |
| Donato Mecca | $256,400 | -- |
Source: Public Records
Mortgage History
| Date | Status | Borrower | Loan Amount |
|---|---|---|---|
| Previous Owner | Konstankevich Igor | $234,500 | |
| Previous Owner | Donato Mecca | $205,120 |
Source: Public Records
Tax History Compared to Growth
Tax History
| Year | Tax Paid | Tax Assessment Tax Assessment Total Assessment is a certain percentage of the fair market value that is determined by local assessors to be the total taxable value of land and additions on the property. | Land | Improvement |
|---|---|---|---|---|
| 2025 | $5,996 | $111,000 | $60,000 | $51,000 |
| 2024 | $5,781 | $111,000 | $60,000 | $51,000 |
| 2023 | $5,781 | $111,000 | $60,000 | $51,000 |
| 2022 | $5,609 | $111,000 | $60,000 | $51,000 |
| 2021 | $4,317 | $111,000 | $60,000 | $51,000 |
| 2020 | $5,353 | $105,300 | $60,000 | $45,300 |
| 2019 | $5,402 | $105,300 | $60,000 | $45,300 |
| 2018 | $5,225 | $105,300 | $60,000 | $45,300 |
| 2017 | $5,218 | $105,300 | $60,000 | $45,300 |
| 2016 | $5,163 | $105,300 | $60,000 | $45,300 |
| 2015 | $5,561 | $117,000 | $60,000 | $57,000 |
| 2014 | $5,471 | $117,000 | $60,000 | $57,000 |
Source: Public Records
Map
Nearby Homes
- 1312 Juniper Ct
- 1111 Hickory Ct
- 3011 Cypress Ct
- 1106 Hickory Ct
- 4031 Bayberry Ct
- 206 Ash Ct
- 3242 Cypress Ct Unit 3242
- 7041 Elm Ct
- 6143 Cedar Ct
- 5192 Beech Ct
- 209 Gambocz Ct
- 32 Magnolia Ct
- 22 Witch Hazel Ct Unit 2
- 30 Magnolia Ct
- 4 Donner Ct
- 6 Donner Ct
- 9 Kearns Place Unit 3805
- 586 Ridge Rd
- 118 Andover Dr
- 147 Major Rd
- 1311 Juniper Ct
- 1313 Juniper Ct
- 1314 Juniper Ct
- 1315 Juniper Ct
- 1403 Locust Ct
- 1309 Juniper Ct
- 1310 Juniper Ct
- 1310 Juniper Ct
- 1308 Juniper Ct
- 1402 Locust Ct
- 1405 Locust Ct
- 1401 Locust Ct
- 1404 Locust Ct
- 1307 Juniper Ct
- 1306 Juniper Ct
- 1305 Juniper Ct
- 1701 Oak Ct
- 1301 Juniper Ct
- 1702 Oak Ct
- 1303 Juniper Ct