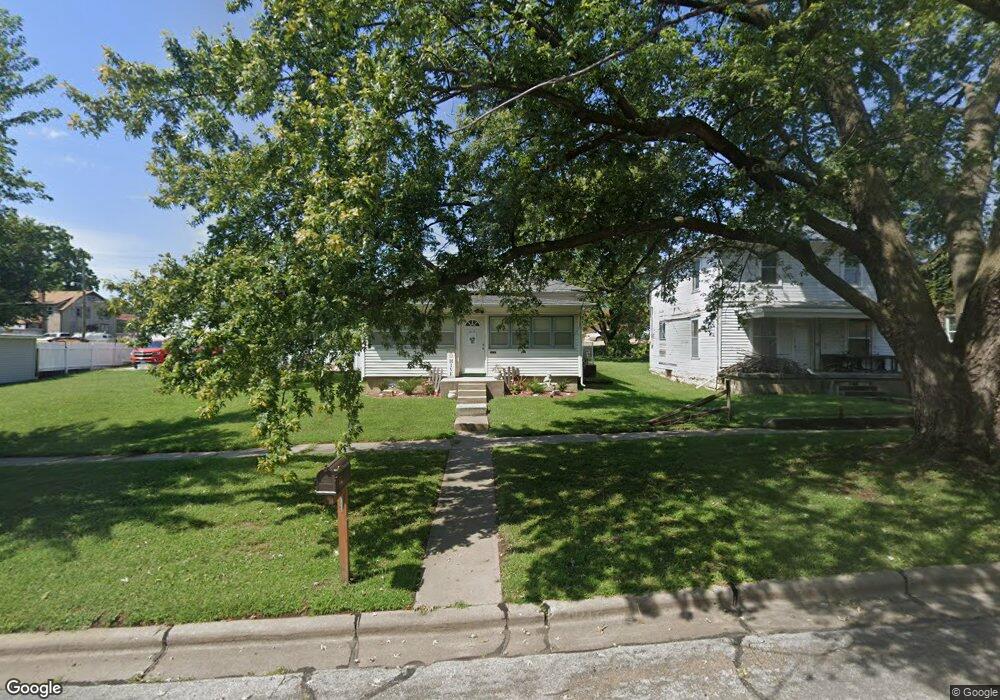
1311 Lane St Falls City, NE 68355
Estimated Value: $64,000 - $98,000
3
Beds
1
Bath
1,016
Sq Ft
$77/Sq Ft
Est. Value
About This Home
This home is located at 1311 Lane St, Falls City, NE 68355 and is currently estimated at $78,606, approximately $77 per square foot. 1311 Lane St is a home located in Richardson County with nearby schools including Falls City North Elementary School, Falls City South Elementary School, and Falls City Middle School.
Ownership History
Date
Name
Owned For
Owner Type
Purchase Details
Closed on
Oct 16, 2013
Sold by
Anne M Anne M and Youde Jason K
Bought by
Dunn Seth R and Dunn Cecilia
Current Estimated Value
Home Financials for this Owner
Home Financials are based on the most recent Mortgage that was taken out on this home.
Original Mortgage
$31,200
Interest Rate
4.56%
Mortgage Type
New Conventional
Purchase Details
Closed on
Jul 28, 2003
Sold by
Youde Anne M
Bought by
Youde Jason K and Youde Anne M
Purchase Details
Closed on
Oct 26, 2002
Sold by
Zirfas Elizabeth A
Bought by
Youde Anne M
Purchase Details
Closed on
Aug 3, 2000
Sold by
Zirfas Elizabeth A
Bought by
Zirfas Elizabeth A
Create a Home Valuation Report for This Property
The Home Valuation Report is an in-depth analysis detailing your home's value as well as a comparison with similar homes in the area
Home Values in the Area
Average Home Value in this Area
Purchase History
| Date | Buyer | Sale Price | Title Company |
|---|---|---|---|
| Dunn Seth R | -- | -- | |
| Youde Jason K | -- | -- | |
| Youde Anne M | -- | -- | |
| Zirfas Elizabeth A | -- | -- |
Source: Public Records
Mortgage History
| Date | Status | Borrower | Loan Amount |
|---|---|---|---|
| Closed | Dunn Seth R | $31,200 |
Source: Public Records
Tax History Compared to Growth
Tax History
| Year | Tax Paid | Tax Assessment Tax Assessment Total Assessment is a certain percentage of the fair market value that is determined by local assessors to be the total taxable value of land and additions on the property. | Land | Improvement |
|---|---|---|---|---|
| 2025 | $622 | $52,142 | $4,453 | $47,689 |
| 2024 | $622 | $49,328 | $4,453 | $44,875 |
| 2023 | $564 | $34,373 | $4,453 | $29,920 |
| 2022 | $615 | $32,034 | $3,164 | $28,870 |
| 2021 | $732 | $39,050 | $3,164 | $35,886 |
| 2020 | $707 | $37,341 | $3,164 | $34,177 |
| 2019 | $699 | $36,346 | $3,164 | $33,182 |
| 2018 | $687 | $35,380 | $3,164 | $32,216 |
| 2017 | $689 | $35,380 | $3,164 | $32,216 |
| 2016 | $667 | $34,442 | $3,164 | $31,278 |
| 2015 | $669 | $34,442 | $3,164 | $31,278 |
| 2014 | $668 | $34,442 | $3,164 | $31,278 |
Source: Public Records
Map
Nearby Homes