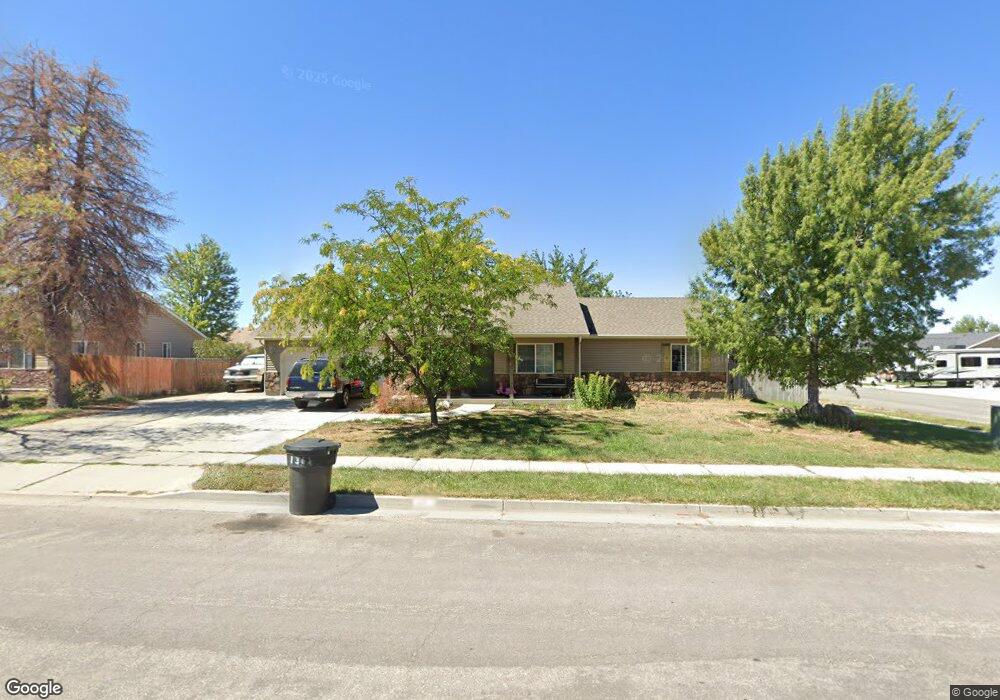
1311 N 500 W Unit 5 Brigham City, UT 84302
Estimated Value: $428,000 - $451,000
--
Bed
--
Bath
1,576
Sq Ft
$277/Sq Ft
Est. Value
About This Home
This home is located at 1311 N 500 W Unit 5, Brigham City, UT 84302 and is currently estimated at $436,643, approximately $277 per square foot. 1311 N 500 W Unit 5 is a home located in Box Elder County with nearby schools including Discovery School, Box Elder Middle School, and Adele C. Young Intermediate School.
Ownership History
Date
Name
Owned For
Owner Type
Purchase Details
Closed on
Jun 15, 2023
Sold by
Ross Jesse D and Ross Marci L
Bought by
Ross Jesse D and Ross Misti C
Current Estimated Value
Home Financials for this Owner
Home Financials are based on the most recent Mortgage that was taken out on this home.
Original Mortgage
$191,595
Outstanding Balance
$186,764
Interest Rate
6.71%
Mortgage Type
FHA
Estimated Equity
$249,879
Purchase Details
Closed on
Oct 26, 2005
Sold by
Whitaker Construction Co Inc
Bought by
Edr Properties Llc
Create a Home Valuation Report for This Property
The Home Valuation Report is an in-depth analysis detailing your home's value as well as a comparison with similar homes in the area
Home Values in the Area
Average Home Value in this Area
Purchase History
| Date | Buyer | Sale Price | Title Company |
|---|---|---|---|
| Ross Jesse D | -- | Vantage Point Title | |
| Edr Properties Llc | -- | None Available |
Source: Public Records
Mortgage History
| Date | Status | Borrower | Loan Amount |
|---|---|---|---|
| Open | Ross Jesse D | $191,595 |
Source: Public Records
Tax History Compared to Growth
Tax History
| Year | Tax Paid | Tax Assessment Tax Assessment Total Assessment is a certain percentage of the fair market value that is determined by local assessors to be the total taxable value of land and additions on the property. | Land | Improvement |
|---|---|---|---|---|
| 2025 | $2,196 | $377,573 | $120,000 | $257,573 |
| 2024 | $1,938 | $373,129 | $115,000 | $258,129 |
| 2023 | $2,001 | $394,515 | $105,000 | $289,515 |
| 2022 | $2,143 | $215,984 | $27,500 | $188,484 |
| 2021 | $1,848 | $269,807 | $50,000 | $219,807 |
| 2020 | $1,661 | $269,807 | $50,000 | $219,807 |
| 2019 | $1,556 | $134,485 | $27,500 | $106,985 |
| 2018 | $1,402 | $120,531 | $27,500 | $93,031 |
| 2017 | $1,329 | $197,791 | $17,160 | $166,591 |
| 2016 | $1,388 | $104,422 | $17,160 | $87,262 |
| 2015 | $1,279 | $96,489 | $17,160 | $79,329 |
| 2014 | $1,279 | $92,711 | $17,160 | $75,551 |
| 2013 | -- | $92,711 | $17,160 | $75,551 |
Source: Public Records
Map
Nearby Homes
- Hailey Plan at Cardamine
- Madison Plan at Cardamine
- Gala Plan at Cardamine
- Chateau Plan at Cardamine
- Phoenix Plan at Cardamine
- Wasatch Plan at Cardamine
- Beachwood Plan at Cardamine
- McIntosh Plan at Cardamine
- 1248 N 600 W
- 373 W 1400 S Unit 47
- 392 W 1400 S Unit 53
- 1306 N 350 W Unit 38
- 950 Wilson Ln
- 1000 Wilson Ln
- 1080 N 575 W
- 324 W 950 N Unit 18
- 242 W 925 N Unit N76
- 266 W 925 N Unit O79
- 271 W 925 N Unit I55
- 267 W 925 N
- 1289 N 500 W
- 1308 N 500 W Unit 10
- 1310 N 550 W
- 1310 N 550 W Unit 22
- 1290 N 550 W
- 518 W 1325 N
- 538 W 1325 N
- 537 W 1325 N
- 1269 N 500 W
- 1276 N 500 W Unit 9
- 1332 N 500 W Unit 12
- 1268 N 550 W
- 1264 N 500 W Unit 8
- 1363 N 500 W
- 1309 N 550 W
- 1309 N 550 W Unit 30
- 1348 N 500 W Unit 13
- 1364 N 550 W
- 1287 N 550 W
- 1287 N 550 W Unit 29