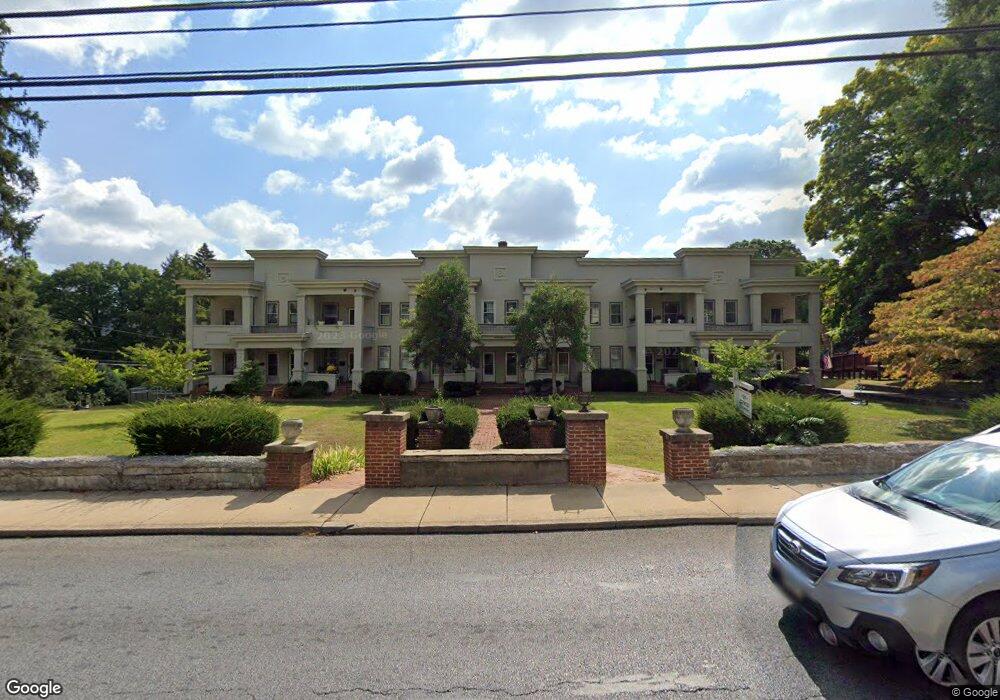
1311 N Augusta St Unit 7 Staunton, VA 24401
Estimated Value: $241,238 - $270,000
3
Beds
2
Baths
1,383
Sq Ft
$181/Sq Ft
Est. Value
About This Home
This home is located at 1311 N Augusta St Unit 7, Staunton, VA 24401 and is currently estimated at $250,810, approximately $181 per square foot. 1311 N Augusta St Unit 7 is a home located in Staunton City with nearby schools including Thomas C. McSwain Elementary School, Shelburne Middle School, and Staunton High School.
Ownership History
Date
Name
Owned For
Owner Type
Purchase Details
Closed on
Nov 2, 2021
Sold by
Bredder Tracey J
Bought by
Schlee Teresa Marie and Schlee John W
Current Estimated Value
Home Financials for this Owner
Home Financials are based on the most recent Mortgage that was taken out on this home.
Original Mortgage
$139,200
Outstanding Balance
$127,553
Interest Rate
2.99%
Mortgage Type
New Conventional
Estimated Equity
$123,257
Purchase Details
Closed on
Aug 3, 2011
Sold by
Dickerson Stephen
Bought by
Bredder Tracey J
Purchase Details
Closed on
May 31, 2007
Sold by
Mcdougall Margaret B
Bought by
Dickerson Stephen
Home Financials for this Owner
Home Financials are based on the most recent Mortgage that was taken out on this home.
Original Mortgage
$90,000
Interest Rate
6.17%
Mortgage Type
New Conventional
Create a Home Valuation Report for This Property
The Home Valuation Report is an in-depth analysis detailing your home's value as well as a comparison with similar homes in the area
Home Values in the Area
Average Home Value in this Area
Purchase History
| Date | Buyer | Sale Price | Title Company |
|---|---|---|---|
| Schlee Teresa Marie | $174,000 | None Available | |
| Bredder Tracey J | $112,000 | None Available | |
| Dickerson Stephen | $140,000 | None Available |
Source: Public Records
Mortgage History
| Date | Status | Borrower | Loan Amount |
|---|---|---|---|
| Open | Schlee Teresa Marie | $139,200 | |
| Previous Owner | Dickerson Stephen | $90,000 |
Source: Public Records
Tax History Compared to Growth
Tax History
| Year | Tax Paid | Tax Assessment Tax Assessment Total Assessment is a certain percentage of the fair market value that is determined by local assessors to be the total taxable value of land and additions on the property. | Land | Improvement |
|---|---|---|---|---|
| 2025 | $1,729 | $190,000 | $13,300 | $176,700 |
| 2024 | $1,525 | $171,400 | $13,300 | $158,100 |
| 2023 | $1,525 | $171,400 | $13,300 | $158,100 |
| 2022 | $1,371 | $149,000 | $13,300 | $135,700 |
| 2021 | $1,371 | $149,000 | $13,300 | $135,700 |
| 2020 | $1,071 | $112,700 | $13,200 | $99,500 |
| 2019 | $1,071 | $112,720 | $13,220 | $99,500 |
| 2018 | $1,093 | $112,720 | $13,220 | $99,500 |
| 2017 | $1,093 | $112,720 | $13,220 | $99,500 |
| 2016 | $1,071 | $112,720 | $13,220 | $99,500 |
| 2015 | $1,071 | $112,720 | $13,220 | $99,500 |
| 2014 | $1,052 | $110,720 | $13,220 | $97,500 |
Source: Public Records
Map
Nearby Homes
- 629 Baptist St
- 1417 N Augusta St
- 108 Caroline St
- 114 Lambert St
- 1203 Windsor Ln
- 509 Randolph St
- 730 Opie St
- 814 N Coalter St
- 410 Glen Ave
- 813 N Coalter St
- 729 Selma Blvd
- 606 and 612 Mason St
- 311 N Lewis St
- 201 N Market St
- 1002 N Coalter St
- 816 Monroe St
- 59,61,61A,63,63 Woodlee Rd
- 1012 Spring Hill Rd
- 1104 N Coalter St
- 1032 Selma Blvd
- 1311 N Augusta St
- 1311 N Augusta St Unit 9
- 1311 N Augusta St Unit 4
- 1311 N Augusta St Unit 3
- 1311 N Augusta St Unit 2
- 1311 N Augusta St Unit 11
- 1311 N Augusta St Unit 10
- 1311 N Augusta St Unit 12
- 1311 N Augusta St Unit 5
- 1311 N Augusta St Unit 8
- 1311 N Augusta St Unit 1
- 1215 N Augusta St
- 1224 Windsor Ln
- 118 Prospect St
- 14 Edgewood Rd
- 1220 Windsor Ln
- 1222 N Augusta St
- 1208 Windsor Ln
- 1205 N Augusta St
- 1228 N Augusta St