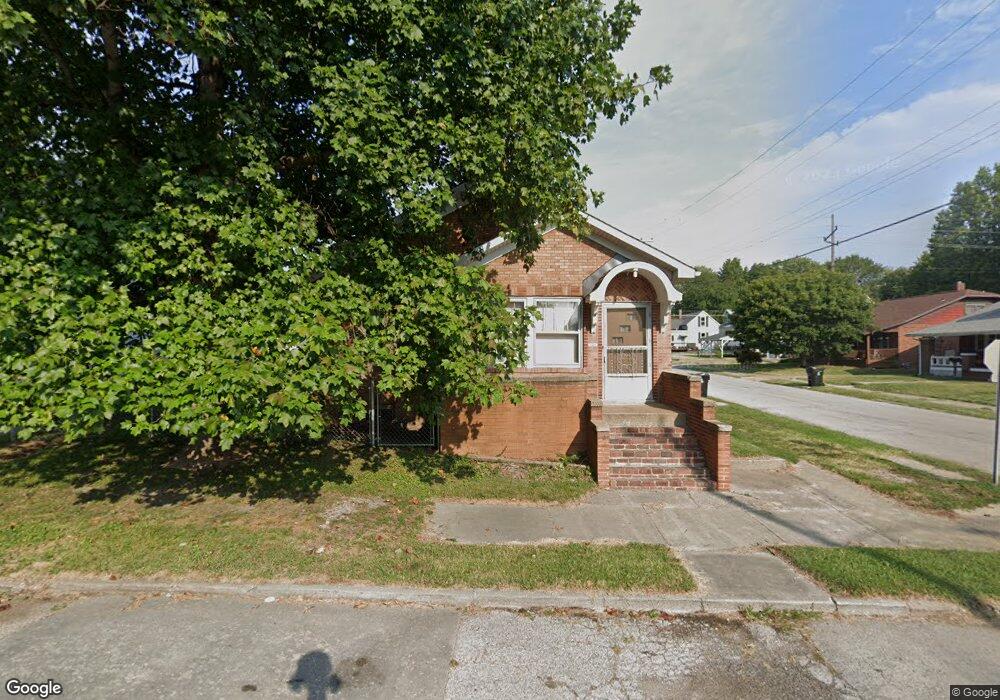
1311 N Charles St Belleville, IL 62221
Estimated Value: $114,000 - $136,407
2
Beds
1
Bath
1,072
Sq Ft
$113/Sq Ft
Est. Value
About This Home
This home is located at 1311 N Charles St, Belleville, IL 62221 and is currently estimated at $120,852, approximately $112 per square foot. 1311 N Charles St is a home located in St. Clair County with nearby schools including Jefferson Elementary School, West Jr High School, and St Teresa Catholic School.
Ownership History
Date
Name
Owned For
Owner Type
Purchase Details
Closed on
May 21, 2014
Sold by
Mason Corey and Mason Carrie
Bought by
Vaughn Bryan E
Current Estimated Value
Purchase Details
Closed on
Jul 10, 2006
Sold by
Pendley Randal Lee and Boyer Pendley Susan F
Bought by
Mason Corey
Home Financials for this Owner
Home Financials are based on the most recent Mortgage that was taken out on this home.
Original Mortgage
$62,320
Interest Rate
7.95%
Mortgage Type
Purchase Money Mortgage
Purchase Details
Closed on
Mar 9, 2001
Sold by
Boyer Pendley Susan F and Pendley Randal Lee
Bought by
Pendley Randal Lee and Boyer Pendley Susan F
Home Financials for this Owner
Home Financials are based on the most recent Mortgage that was taken out on this home.
Original Mortgage
$53,596
Interest Rate
7.18%
Mortgage Type
VA
Create a Home Valuation Report for This Property
The Home Valuation Report is an in-depth analysis detailing your home's value as well as a comparison with similar homes in the area
Home Values in the Area
Average Home Value in this Area
Purchase History
| Date | Buyer | Sale Price | Title Company |
|---|---|---|---|
| Vaughn Bryan E | $26,000 | Fatic | |
| Mason Corey | $78,000 | Fatic | |
| Pendley Randal Lee | -- | Towne & Country Title Inc |
Source: Public Records
Mortgage History
| Date | Status | Borrower | Loan Amount |
|---|---|---|---|
| Previous Owner | Mason Corey | $62,320 | |
| Previous Owner | Pendley Randal Lee | $53,596 |
Source: Public Records
Tax History
| Year | Tax Paid | Tax Assessment Tax Assessment Total Assessment is a certain percentage of the fair market value that is determined by local assessors to be the total taxable value of land and additions on the property. | Land | Improvement |
|---|---|---|---|---|
| 2024 | $2,480 | $34,203 | $2,617 | $31,586 |
| 2023 | $2,122 | $28,604 | $2,565 | $26,039 |
| 2022 | $1,890 | $25,751 | $2,309 | $23,442 |
| 2021 | $1,775 | $23,806 | $2,135 | $21,671 |
| 2020 | $1,700 | $22,513 | $2,019 | $20,494 |
| 2019 | $1,749 | $22,885 | $2,023 | $20,862 |
| 2018 | $1,697 | $22,390 | $1,979 | $20,411 |
| 2017 | $1,165 | $22,233 | $1,965 | $20,268 |
| 2016 | $2,271 | $21,761 | $1,923 | $19,838 |
| 2014 | $1,063 | $22,998 | $1,747 | $21,251 |
| 2013 | $2,104 | $23,327 | $1,772 | $21,555 |
Source: Public Records
Map
Nearby Homes
- 1316 N Church St
- 1406 N Church St
- 1411 N Church St
- 1210 N Church St
- 1114 La Salle St
- 1803 Scheel St
- 710 Lebanon Ave
- 1604 N Church St
- 512 Kansas Ave
- 1621 La Salle St
- 1805 Page Ave
- 1801 E Belle Ave
- 1644 N Church St
- 1715 Muren Blvd
- 802 N Church St
- 709 Benton St
- 1711 Lasalle St
- 1804 Muren Blvd
- 1910 E Belle Ave
- 1801 E C St
- 1309 N Charles St
- 809 Lucinda Ave
- 1307 N Charles St
- 1303 N Charles St
- 800 Lucinda Ave
- 804 Lucinda Ave
- 1305 N Charles St
- 808 Lucinda Ave
- 1310 N Charles St
- 1312 N Charles St
- 1308 N Charles St
- 1318 N Church St
- 1306 N Charles St
- 1312 N Church St
- 1405 N Charles St
- 1301 N Charles St
- 1400 N Church St
- 1304 N Charles St
- 819 Arthur St
- 1308 N Church St
Your Personal Tour Guide
Ask me questions while you tour the home.