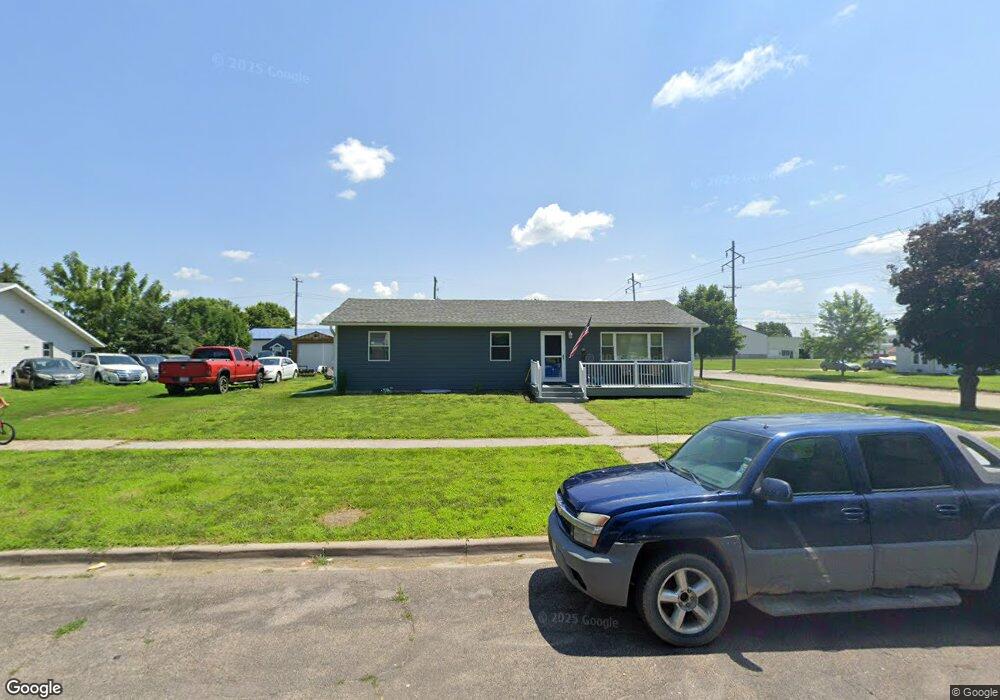
1311 S 2nd St Norfolk, NE 68701
Estimated Value: $137,000 - $240,228
3
Beds
2
Baths
1,248
Sq Ft
$163/Sq Ft
Est. Value
About This Home
This home is located at 1311 S 2nd St, Norfolk, NE 68701 and is currently estimated at $203,307, approximately $162 per square foot. 1311 S 2nd St is a home located in Madison County with nearby schools including Norfolk Senior High School, Christ Lutheran School, and Keystone Christian Academy.
Ownership History
Date
Name
Owned For
Owner Type
Purchase Details
Closed on
Jun 5, 2025
Sold by
Shannon Liliana E
Bought by
Norfolk United Developers Llc
Current Estimated Value
Purchase Details
Closed on
Nov 5, 2018
Sold by
Chuster Lorna M
Bought by
Hoene Cecil
Home Financials for this Owner
Home Financials are based on the most recent Mortgage that was taken out on this home.
Original Mortgage
$114,468
Interest Rate
4.62%
Mortgage Type
FHA
Create a Home Valuation Report for This Property
The Home Valuation Report is an in-depth analysis detailing your home's value as well as a comparison with similar homes in the area
Home Values in the Area
Average Home Value in this Area
Purchase History
| Date | Buyer | Sale Price | Title Company |
|---|---|---|---|
| Norfolk United Developers Llc | $121,934 | None Listed On Document | |
| Norfolk United Developers Llc | $121,934 | None Listed On Document | |
| Hoene Cecil | $125,000 | Northeast Nebraska Title & E |
Source: Public Records
Mortgage History
| Date | Status | Borrower | Loan Amount |
|---|---|---|---|
| Previous Owner | Hoene Cecil | $114,468 |
Source: Public Records
Tax History Compared to Growth
Tax History
| Year | Tax Paid | Tax Assessment Tax Assessment Total Assessment is a certain percentage of the fair market value that is determined by local assessors to be the total taxable value of land and additions on the property. | Land | Improvement |
|---|---|---|---|---|
| 2024 | $2,562 | $206,292 | $10,700 | $195,592 |
| 2023 | $3,515 | $190,142 | $10,700 | $179,442 |
| 2022 | $2,558 | $138,025 | $10,700 | $127,325 |
| 2021 | $2,359 | $127,512 | $10,700 | $116,812 |
| 2020 | $2,174 | $117,867 | $10,700 | $107,167 |
| 2019 | $2,032 | $106,385 | $10,700 | $95,685 |
| 2018 | $1,998 | $106,385 | $10,700 | $95,685 |
| 2017 | $0 | $96,133 | $10,700 | $85,433 |
| 2016 | $0 | $89,012 | $9,907 | $79,105 |
| 2015 | $1,172 | $89,012 | $9,907 | $79,105 |
| 2014 | $38 | $85,245 | $9,907 | $75,338 |
| 2013 | $42 | $80,316 | $9,907 | $70,409 |
Source: Public Records
Map
Nearby Homes