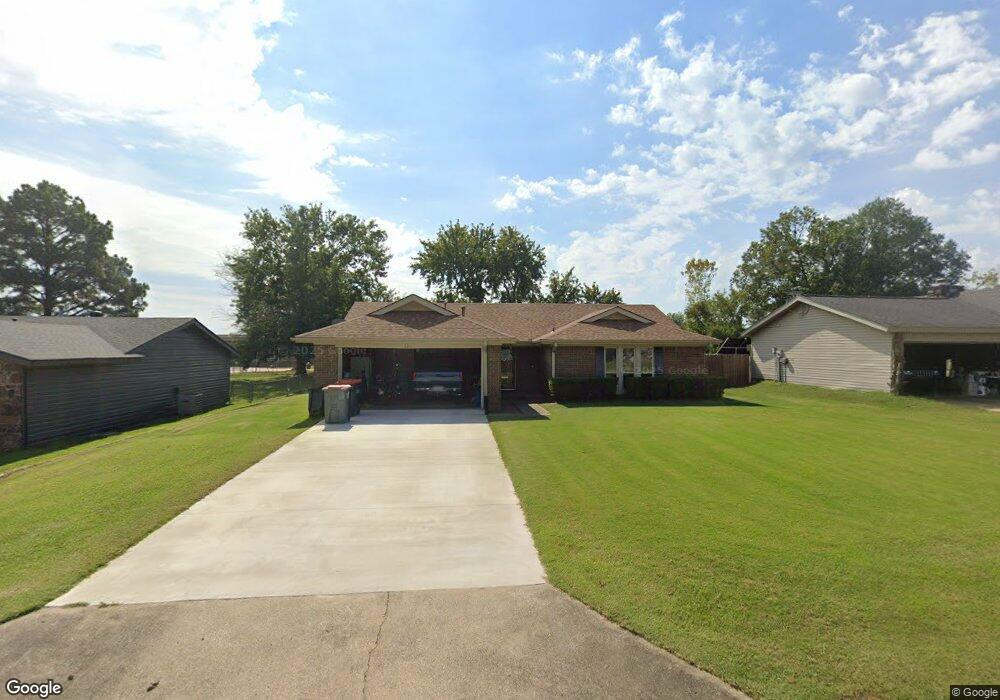
1311 Strozier Ct Barling, AR 72923
Estimated Value: $175,862 - $206,000
--
Bed
2
Baths
1,481
Sq Ft
$132/Sq Ft
Est. Value
About This Home
This home is located at 1311 Strozier Ct, Barling, AR 72923 and is currently estimated at $196,216, approximately $132 per square foot. 1311 Strozier Ct is a home located in Sebastian County with nearby schools including Barling Elementary School, L.A. Chaffin Junior High School, and Southside High School.
Ownership History
Date
Name
Owned For
Owner Type
Purchase Details
Closed on
Jul 6, 2007
Sold by
Knox Andy and Knox Alicia
Bought by
Johnson Thomas J
Current Estimated Value
Home Financials for this Owner
Home Financials are based on the most recent Mortgage that was taken out on this home.
Original Mortgage
$110,000
Outstanding Balance
$67,637
Interest Rate
6.37%
Mortgage Type
VA
Estimated Equity
$128,579
Purchase Details
Closed on
Feb 4, 2005
Sold by
Knox Andrew L and Knox Alicia L
Bought by
Lowry Richard D
Home Financials for this Owner
Home Financials are based on the most recent Mortgage that was taken out on this home.
Original Mortgage
$79,000
Interest Rate
5.8%
Mortgage Type
New Conventional
Purchase Details
Closed on
Dec 14, 1995
Bought by
Linson
Purchase Details
Closed on
Oct 3, 1989
Bought by
Gattis
Purchase Details
Closed on
Mar 17, 1981
Bought by
Greb
Purchase Details
Closed on
Jun 7, 1978
Bought by
Drew
Create a Home Valuation Report for This Property
The Home Valuation Report is an in-depth analysis detailing your home's value as well as a comparison with similar homes in the area
Home Values in the Area
Average Home Value in this Area
Purchase History
| Date | Buyer | Sale Price | Title Company |
|---|---|---|---|
| Johnson Thomas J | $110,000 | Guaranty Abstract | |
| Lowry Richard D | -- | None Available | |
| Linson | $71,000 | -- | |
| Gattis | $58,000 | -- | |
| Greb | $45,000 | -- | |
| Drew | $42,000 | -- |
Source: Public Records
Mortgage History
| Date | Status | Borrower | Loan Amount |
|---|---|---|---|
| Open | Johnson Thomas J | $110,000 | |
| Previous Owner | Lowry Richard D | $79,000 |
Source: Public Records
Tax History Compared to Growth
Tax History
| Year | Tax Paid | Tax Assessment Tax Assessment Total Assessment is a certain percentage of the fair market value that is determined by local assessors to be the total taxable value of land and additions on the property. | Land | Improvement |
|---|---|---|---|---|
| 2025 | $1,255 | $34,711 | $3,400 | $31,311 |
| 2024 | $1,071 | $21,500 | $3,400 | $18,100 |
| 2023 | $1,071 | $21,500 | $3,400 | $18,100 |
| 2022 | $1,071 | $21,500 | $3,400 | $18,100 |
| 2021 | $1,190 | $21,500 | $3,400 | $18,100 |
| 2020 | $1,175 | $21,500 | $3,400 | $18,100 |
| 2019 | $1,119 | $20,220 | $3,600 | $16,620 |
| 2018 | $1,007 | $20,220 | $3,600 | $16,620 |
| 2017 | $1,007 | $20,220 | $3,600 | $16,620 |
| 2016 | $1,007 | $20,220 | $3,600 | $16,620 |
| 2015 | $1,007 | $20,220 | $3,600 | $16,620 |
| 2014 | $1,021 | $20,500 | $3,600 | $16,900 |
Source: Public Records
Map
Nearby Homes
- 1107 E St
- 523 Joann Way
- 1704 Ebbing Loop
- 1914 Ebbing Loop
- 1129 Hunters Point Ct
- 1101 Hunters Point Ct
- 405 Buffalo Pass
- 409 Dutton Ct
- 404 Waggoner Ln
- Lot 88 Dutton Ct
- 405 Dutton Ct
- 404 Buffalo Pass
- Lot 52 Waggoner Ln
- 508 Buffalo Pass
- 415 Dutton Ct
- Lot 79 Buffalo Pass
- 505 Dutton Ct
- 409 Buffalo Pass
- Lot 31 Dutton Ct
- 508 Dutton Ct
- 1309 Strozier Ct
- 1401 Strozier Ct
- 1307 Strozier Ct
- 1403 Strozier Ct
- 1310 Strozier Ct
- 1308 Strozier Ct
- 1405 Strozier Ct
- 1305 Strozier Ct
- 1306 Strozier Ct
- 1402 Strozier Ct
- 1304 Strozier Ct
- 1404 Strozier Ct
- 1407 Strozier Ct
- 1303 Strozier Ct
- 1406 Strozier Ct
- 1501 Strozier Ct
- 1301 Strozier Ct
- 1502 Strozier Ct
- 1503 Strozier Ct
- 1504 Strozier Ct