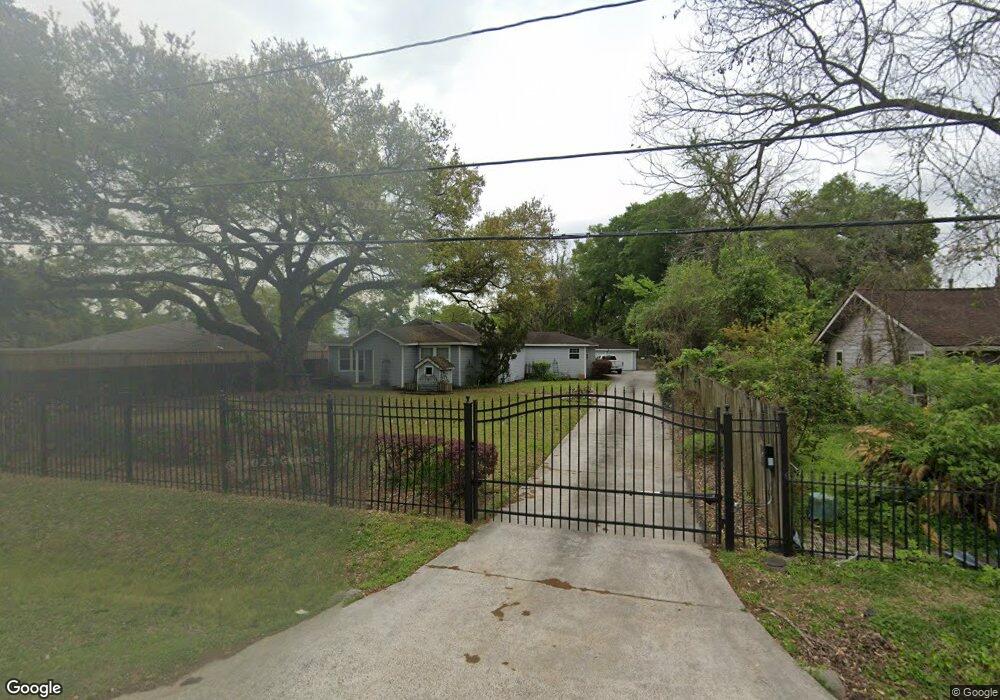
1311 Wilburforce St Houston, TX 77091
Acres Homes NeighborhoodEstimated Value: $378,000 - $634,000
3
Beds
2
Baths
2,711
Sq Ft
$190/Sq Ft
Est. Value
About This Home
This home is located at 1311 Wilburforce St, Houston, TX 77091 and is currently estimated at $515,570, approximately $190 per square foot. 1311 Wilburforce St is a home located in Harris County with nearby schools including Reece Academy, Anderson Academy, and Drew Academy.
Ownership History
Date
Name
Owned For
Owner Type
Purchase Details
Closed on
Sep 28, 2022
Sold by
Heads Jr James A
Bought by
Heads Darius L
Current Estimated Value
Purchase Details
Closed on
Oct 29, 1997
Sold by
Lockridge Jesse and Lockridge Minnie Lee
Bought by
Heads James A and Heads Leona K
Purchase Details
Closed on
Jun 26, 1993
Sold by
Heads James
Bought by
Heads James and Heads Leona Kaye
Create a Home Valuation Report for This Property
The Home Valuation Report is an in-depth analysis detailing your home's value as well as a comparison with similar homes in the area
Home Values in the Area
Average Home Value in this Area
Purchase History
| Date | Buyer | Sale Price | Title Company |
|---|---|---|---|
| Heads Darius L | -- | -- | |
| Heads James A | -- | -- | |
| Heads James | -- | -- |
Source: Public Records
Tax History Compared to Growth
Tax History
| Year | Tax Paid | Tax Assessment Tax Assessment Total Assessment is a certain percentage of the fair market value that is determined by local assessors to be the total taxable value of land and additions on the property. | Land | Improvement |
|---|---|---|---|---|
| 2025 | $60 | $511,962 | $393,245 | $118,717 |
| 2024 | $60 | $512,648 | $393,245 | $119,403 |
| 2023 | $60 | $446,349 | $341,952 | $104,397 |
| 2022 | $5,393 | $335,011 | $213,720 | $121,291 |
| 2021 | $5,135 | $282,291 | $170,976 | $111,315 |
| 2020 | $4,905 | $217,788 | $106,860 | $110,928 |
| 2019 | $4,675 | $192,175 | $106,860 | $85,315 |
| 2018 | $1,436 | $153,580 | $72,665 | $80,915 |
| 2017 | $3,968 | $153,580 | $72,665 | $80,915 |
| 2016 | $3,607 | $135,965 | $64,116 | $71,849 |
| 2015 | $2,915 | $135,965 | $64,116 | $71,849 |
| 2014 | $2,915 | $129,295 | $40,607 | $88,688 |
Source: Public Records
Map
Nearby Homes
- 1116 Wilburforce St
- 1406 Homer St Unit 2
- 6637 Katarani Dr
- 2216 Wilburforce St
- 000 Wilburforce St
- 1049 Wilburforce St
- 1626 and 1630 Wilburforce St
- 6635 Katarani Dr
- 0 Wheatley St Unit 79361448
- 0 Wheatley St Unit 22751445
- 6633 Katarani Dr
- 5802 Burt St
- 6419 Wheatley St
- 1202 De Soto St
- 1213 De Soto St
- TBD-01-01 Wheatley St
- 6601 Wheatley St
- 1321 De Soto St
- 1040 Homer St Unit B
- 0 De Soto St
- 1307 Wilburforce St
- 1320 Wilburforce St
- 1319 Wilburforce St
- 1305 Wilburforce St
- 1324 Wilburforce St
- 1316 Wilburforce St
- 6511 Branford St
- 1321 Wilburforce St
- 6515 Branford St
- 6518 Branford St
- 1202 Wilburforce St
- 6519 Branford St
- 6522 Branford St
- 6427 Highland Pine Ln
- 6417 Highland Pine Ln
- 6423 Highland Pine Ln
- 6421 Highland Pine Ln
- 6425 Highland Pine Ln
- 6419 Highland Pine Ln
- 6415 Highland Pine Ln