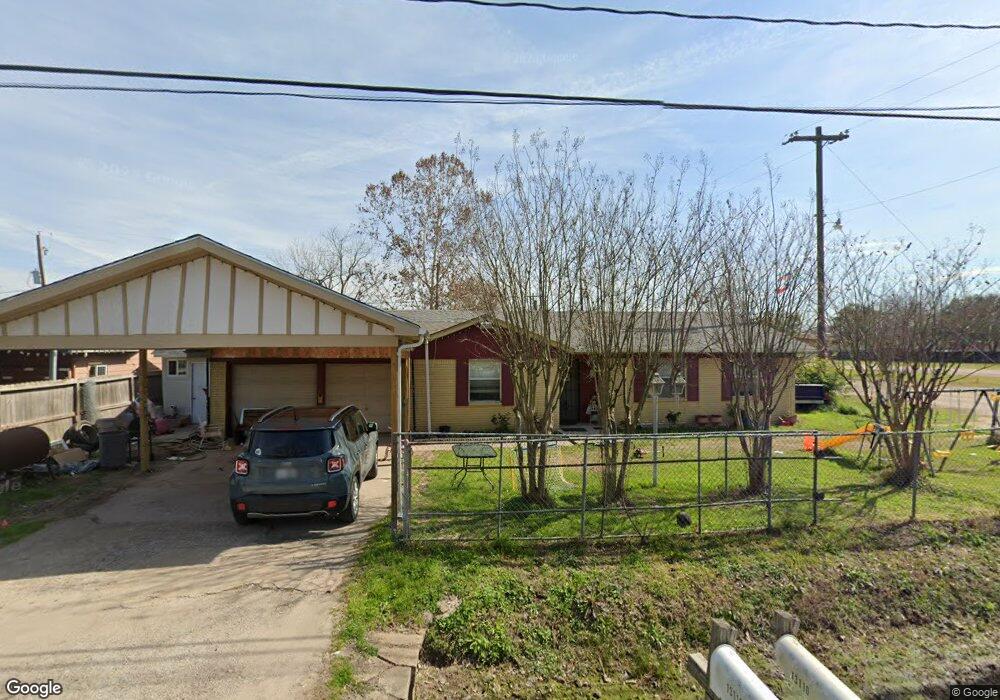
13110 Chrisman Rd Houston, TX 77039
Estimated Value: $220,000 - $376,000
3
Beds
2
Baths
1,778
Sq Ft
$162/Sq Ft
Est. Value
About This Home
This home is located at 13110 Chrisman Rd, Houston, TX 77039 and is currently estimated at $288,850, approximately $162 per square foot. 13110 Chrisman Rd is a home located in Harris County with nearby schools including Vardeman EC/PK/K, Reed Academy, and Grantham Academy.
Ownership History
Date
Name
Owned For
Owner Type
Purchase Details
Closed on
Sep 20, 2016
Sold by
Gallegos Mario A and Gallegos Francela
Bought by
Robles Claudia A and Lopez Omar
Current Estimated Value
Home Financials for this Owner
Home Financials are based on the most recent Mortgage that was taken out on this home.
Original Mortgage
$101,325
Outstanding Balance
$80,987
Interest Rate
3.45%
Mortgage Type
FHA
Estimated Equity
$207,864
Purchase Details
Closed on
Jan 28, 2009
Sold by
Phimmasone Limseune and Phimmasone Somsamay J
Bought by
Gallegos Mario A and Guerrero Francela
Purchase Details
Closed on
Jul 12, 2002
Sold by
Phimmasone Thongsa and Phimmasone Chantha
Bought by
Phimmasone Limseune and Phimmasone Somsamay J
Home Financials for this Owner
Home Financials are based on the most recent Mortgage that was taken out on this home.
Original Mortgage
$61,750
Interest Rate
6.73%
Create a Home Valuation Report for This Property
The Home Valuation Report is an in-depth analysis detailing your home's value as well as a comparison with similar homes in the area
Home Values in the Area
Average Home Value in this Area
Purchase History
| Date | Buyer | Sale Price | Title Company |
|---|---|---|---|
| Robles Claudia A | -- | Capital Title | |
| Gallegos Mario A | -- | First American Title | |
| Phimmasone Limseune | -- | -- |
Source: Public Records
Mortgage History
| Date | Status | Borrower | Loan Amount |
|---|---|---|---|
| Open | Robles Claudia A | $101,325 | |
| Previous Owner | Phimmasone Limseune | $61,750 |
Source: Public Records
Tax History Compared to Growth
Tax History
| Year | Tax Paid | Tax Assessment Tax Assessment Total Assessment is a certain percentage of the fair market value that is determined by local assessors to be the total taxable value of land and additions on the property. | Land | Improvement |
|---|---|---|---|---|
| 2025 | $1,732 | $254,185 | $39,463 | $214,722 |
| 2024 | $1,732 | $252,667 | $39,463 | $213,204 |
| 2023 | $1,732 | $268,765 | $43,848 | $224,917 |
| 2022 | $2,605 | $126,668 | $19,967 | $106,701 |
| 2021 | $2,730 | $126,668 | $19,967 | $106,701 |
| 2020 | $2,877 | $126,668 | $19,967 | $106,701 |
| 2019 | $2,333 | $98,093 | $19,967 | $78,126 |
| 2018 | $1,409 | $98,093 | $19,967 | $78,126 |
| 2017 | $2,223 | $98,093 | $19,967 | $78,126 |
| 2016 | $2,111 | $93,162 | $19,967 | $73,195 |
| 2015 | $1,761 | $93,162 | $19,967 | $73,195 |
| 2014 | $1,761 | $93,162 | $19,967 | $73,195 |
Source: Public Records
Map
Nearby Homes
- 13113 Reeveston Rd
- 13310 Robertcrest St Unit B
- 1810 Connorvale Rd
- 13635 Reeveston Rd
- 13530 Luthe Rd
- 28351 W Hardy Rd
- 1720 Strawn Rd
- 12969 W Hardy Rd
- 1730 Strawn Rd
- 1722 Strawn Rd
- 1725 Strawn Rd
- 14215 Sweeney Rd
- 13610 Carmilenda St
- 12123 Steeple Ln
- 13920 Reeveston Rd
- 13917 Chrisman Rd
- 0 Verhalen
- 822 Aldine Mail Route Rd
- 814 Isetta Ln
- 1916 Gault Rd
- 13114 Chrisman Rd
- 1514 Debeney Dr
- 13202 Chrisman Rd
- 1510 Debeney Dr
- 13203 Chrisman Rd Unit S191
- 13206 Chrisman Rd
- 13205 Chrisman Rd
- 13201 Chrisman Rd
- 13201 Chrisman Rd
- 13209 Chrisman Rd
- 1518 Debeney Dr
- 1506 Debeney Dr
- 13115 Chrisman Rd
- 13213 Chrisman Rd
- 13210 Chrisman Rd
- 13111 Chrisman Rd
- 1502 Debeney Dr
- 1522 Debeney Dr
- 13217 Chrisman Rd
- 1519 Debeney Dr