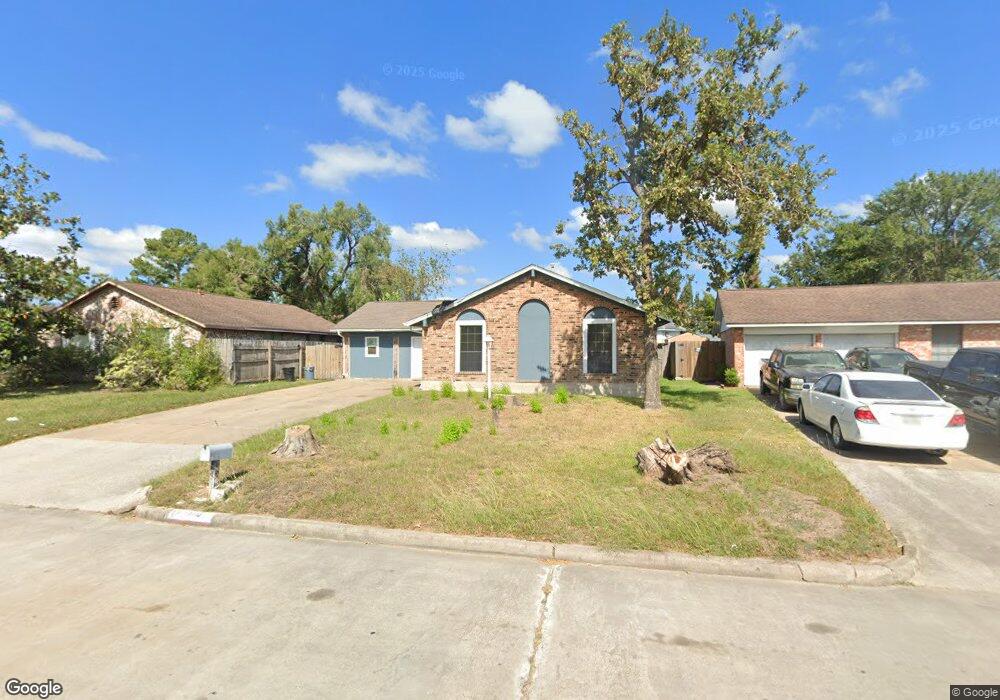
13110 Winding Wood Dr Houston, TX 77038
North Houston NeighborhoodEstimated Value: $201,079 - $233,000
4
Beds
2
Baths
1,247
Sq Ft
$176/Sq Ft
Est. Value
About This Home
This home is located at 13110 Winding Wood Dr, Houston, TX 77038 and is currently estimated at $220,020, approximately $176 per square foot. 13110 Winding Wood Dr is a home located in Harris County with nearby schools including Gloria B. Sammons Elementary School, Stovall School, and Dr. Viola K. Garcia Middle School.
Ownership History
Date
Name
Owned For
Owner Type
Purchase Details
Closed on
Dec 13, 2002
Sold by
Dukmak Miguel F and Dukmak Miriam
Bought by
Abner James L
Current Estimated Value
Home Financials for this Owner
Home Financials are based on the most recent Mortgage that was taken out on this home.
Original Mortgage
$55,134
Outstanding Balance
$23,086
Interest Rate
5.89%
Mortgage Type
FHA
Estimated Equity
$196,935
Purchase Details
Closed on
May 23, 1995
Sold by
Va
Bought by
Dukmak Miguel F
Home Financials for this Owner
Home Financials are based on the most recent Mortgage that was taken out on this home.
Original Mortgage
$54,806
Interest Rate
8%
Mortgage Type
Seller Take Back
Purchase Details
Closed on
Sep 6, 1994
Sold by
Magnolia Federal Bank For Svgs
Bought by
Va
Create a Home Valuation Report for This Property
The Home Valuation Report is an in-depth analysis detailing your home's value as well as a comparison with similar homes in the area
Home Values in the Area
Average Home Value in this Area
Purchase History
| Date | Buyer | Sale Price | Title Company |
|---|---|---|---|
| Abner James L | -- | Fidelity National Title | |
| Dukmak Miguel F | -- | -- | |
| Va | -- | Fidelity National Title | |
| Magnolia Federal Bank For Svgs | -- | -- |
Source: Public Records
Mortgage History
| Date | Status | Borrower | Loan Amount |
|---|---|---|---|
| Open | Abner James L | $55,134 | |
| Previous Owner | Dukmak Miguel F | $54,806 | |
| Closed | Abner James L | $5,000 |
Source: Public Records
Tax History Compared to Growth
Tax History
| Year | Tax Paid | Tax Assessment Tax Assessment Total Assessment is a certain percentage of the fair market value that is determined by local assessors to be the total taxable value of land and additions on the property. | Land | Improvement |
|---|---|---|---|---|
| 2025 | $1,058 | $170,039 | $36,771 | $133,268 |
| 2024 | $1,058 | $168,649 | $36,771 | $131,878 |
| 2023 | $1,058 | $168,649 | $36,771 | $131,878 |
| 2022 | $3,442 | $150,699 | $36,771 | $113,928 |
| 2021 | $3,242 | $130,263 | $22,063 | $108,200 |
| 2020 | $3,124 | $130,263 | $22,063 | $108,200 |
| 2019 | $2,945 | $112,644 | $22,063 | $90,581 |
| 2018 | $238 | $107,962 | $22,063 | $85,899 |
| 2017 | $2,390 | $107,962 | $22,063 | $85,899 |
| 2016 | $2,172 | $88,220 | $22,063 | $66,157 |
| 2015 | $684 | $89,468 | $22,063 | $67,405 |
| 2014 | $684 | $58,360 | $14,708 | $43,652 |
Source: Public Records
Map
Nearby Homes
- 2203 Chalet Rd
- 2614 Lemonwood Ln
- 00 Fallbrook Dr
- 2115 Havencrest Dr
- 0 W Mt Houston Rd Unit 90464120
- 2530 Woodtown Dr
- 1327 Fallbrook Dr
- 2719 Magnolia Hill Trail
- 12718 Sai Baba Dr
- 2811 Oakland Brook St
- 2831 Oakland Brook St
- 2835 Oakland Brook St
- 10519 Pleasanton Dr
- 1219 Pilot Point Dr
- 2838 Packard Elm St
- 10558 Pleasanton Dr
- 1506 Wilshire Park Dr
- 1138 Cherry Spring Dr
- 1019 Castolan Dr
- 1022 Progreso Dr
- 13114 Winding Wood Dr
- 13106 Winding Wood Dr
- 13118 Winding Wood Dr
- 13102 Woodsdale Ct
- 13102 Winding Wood Dr
- 13103 Woodsdale Ct
- 13143 Daywood Dr
- 13123 Daywood Dr
- 13122 Winding Wood Dr
- 13106 Woodsdale Ct
- 13111 Winding Wood Dr
- 13107 Woodsdale Ct
- 13119 Daywood Dr
- 13115 Winding Wood Dr
- 13126 Winding Wood Dr
- 13147 Daywood Dr
- 13110 Woodsdale Ct
- 13115 Daywood Dr
- 13134 Daywood Dr
- 13142 Winding Wood Dr