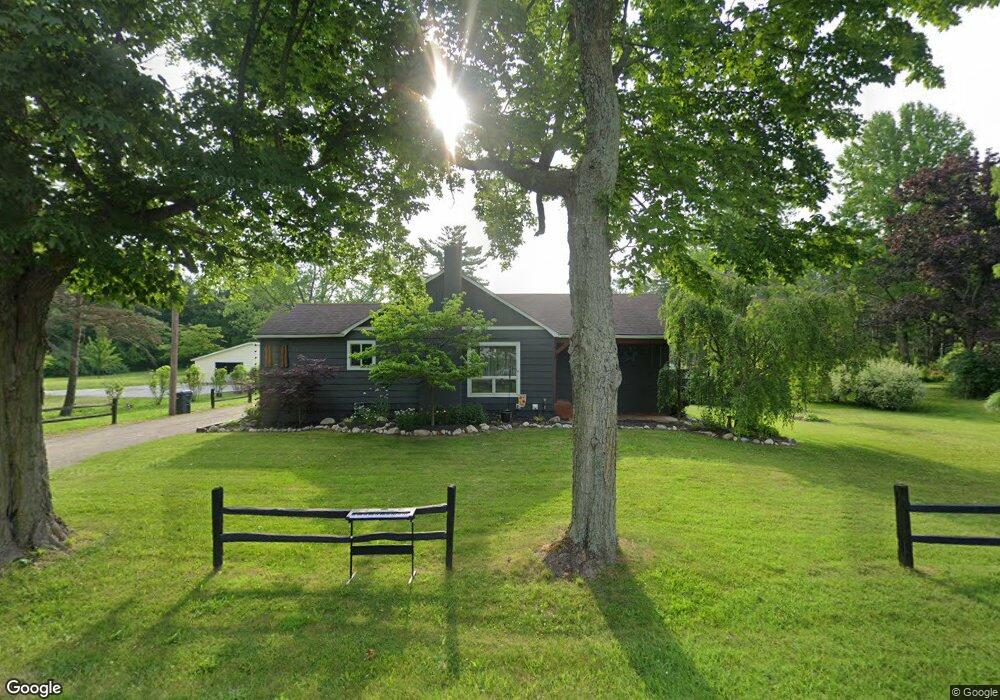
13113 72nd St South Haven, MI 49090
Estimated Value: $223,000 - $303,000
2
Beds
2
Baths
1,494
Sq Ft
$175/Sq Ft
Est. Value
About This Home
This home is located at 13113 72nd St, South Haven, MI 49090 and is currently estimated at $260,805, approximately $174 per square foot. 13113 72nd St is a home located in Van Buren County with nearby schools including South Haven High School, St. Paul Lutheran School, and St. Basil School.
Ownership History
Date
Name
Owned For
Owner Type
Purchase Details
Closed on
Apr 22, 2024
Sold by
Loyd-Price Susan
Bought by
Loyd-Price Susan and Jeremy Price And Susan Loyd-Price Trust
Current Estimated Value
Purchase Details
Closed on
Aug 23, 2023
Sold by
Price Jeremy
Bought by
Loyd-Price Susan
Purchase Details
Closed on
Oct 7, 2022
Sold by
Loyd Susan M
Bought by
Loyd-Price Susan M and Price Jeremy
Home Financials for this Owner
Home Financials are based on the most recent Mortgage that was taken out on this home.
Original Mortgage
$103,500
Interest Rate
5.89%
Mortgage Type
New Conventional
Purchase Details
Closed on
May 26, 2004
Sold by
Loyd Richard A and Loyd Kathy A
Bought by
Loyd Susan M
Purchase Details
Closed on
Jun 23, 2003
Bought by
Loyd Richard A and Loyd Kathy A
Purchase Details
Closed on
Dec 21, 2002
Sold by
Frye Dennie C
Bought by
Dept Veterans Affairs Of Usa
Purchase Details
Closed on
Oct 1, 1999
Sold by
Higgs Glen R and Higgs Susan
Bought by
Frye Dennie C
Create a Home Valuation Report for This Property
The Home Valuation Report is an in-depth analysis detailing your home's value as well as a comparison with similar homes in the area
Home Values in the Area
Average Home Value in this Area
Purchase History
| Date | Buyer | Sale Price | Title Company |
|---|---|---|---|
| Loyd-Price Susan | -- | None Listed On Document | |
| Loyd-Price Susan | -- | None Listed On Document | |
| Loyd-Price Susan M | -- | Chicago Title | |
| Loyd Susan M | -- | -- | |
| Loyd Richard A | $77,700 | -- | |
| Dept Veterans Affairs Of Usa | -- | -- | |
| Frye Dennie C | $89,500 | -- |
Source: Public Records
Mortgage History
| Date | Status | Borrower | Loan Amount |
|---|---|---|---|
| Previous Owner | Loyd-Price Susan M | $103,500 |
Source: Public Records
Tax History Compared to Growth
Tax History
| Year | Tax Paid | Tax Assessment Tax Assessment Total Assessment is a certain percentage of the fair market value that is determined by local assessors to be the total taxable value of land and additions on the property. | Land | Improvement |
|---|---|---|---|---|
| 2025 | $1,341 | $111,000 | $0 | $0 |
| 2024 | $656 | $108,700 | $0 | $0 |
| 2023 | $625 | $91,700 | $0 | $0 |
| 2022 | $1,210 | $76,400 | $0 | $0 |
| 2021 | $1,146 | $65,600 | $12,500 | $53,100 |
| 2020 | $1,132 | $65,400 | $12,500 | $52,900 |
| 2019 | $1,075 | $57,300 | $16,600 | $40,700 |
| 2018 | $1,544 | $53,900 | $22,500 | $31,400 |
| 2017 | $1,351 | $39,200 | $6,500 | $32,700 |
| 2016 | $1,352 | $38,800 | $6,500 | $32,300 |
| 2015 | $796 | $38,800 | $6,500 | $32,300 |
| 2014 | $864 | $27,600 | $0 | $0 |
| 2013 | -- | $26,100 | $12,000 | $14,100 |
Source: Public Records
Map
Nearby Homes
- 69636 County Road 384
- 13670 73rd St
- 10505 Compton Dr Unit 1
- 72597 Faye Ct
- 70386 M 43 Unit Lot C
- 13537 M 140
- 74213 10th Ave
- 13241 Deercreek Ct
- 09279 M-140 Hwy
- 15010 Highway M-140
- 14606 Crest View Ct
- Parcel ABC 73rd St
- 0 73rd St
- 326 Blue Star Hwy
- 0 14th Ave Unit 25012379
- V/L 12th Ave
- v/l Blue Star Hwy
- 68687 Michigan 43
- 5640 Blue Star Hwy
- 5122 Parkview Ln