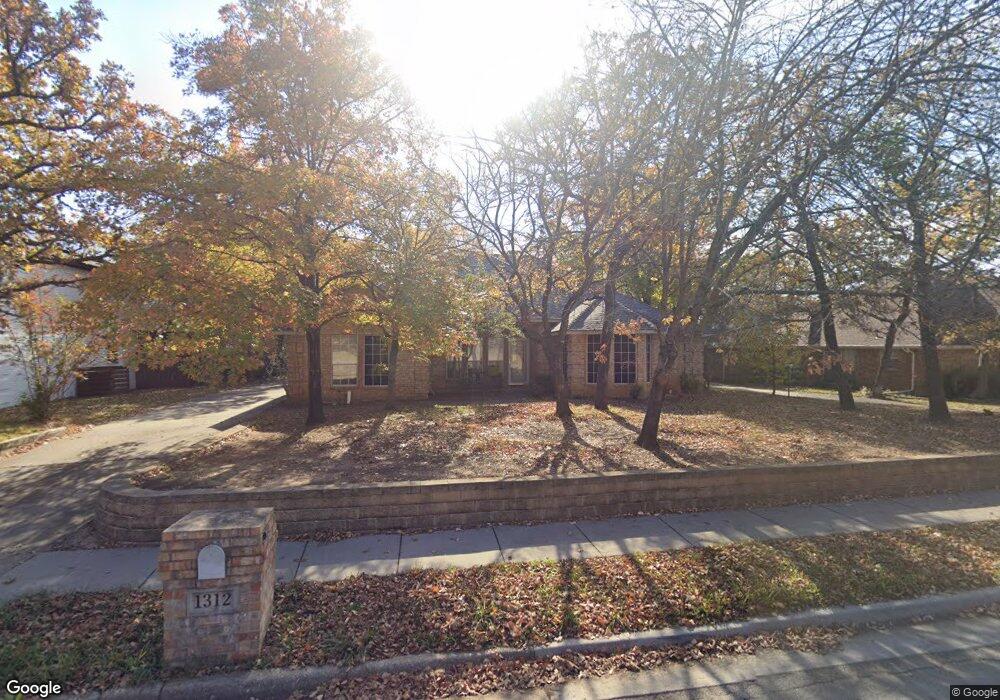
1312 Briar Dr Bedford, TX 76022
Estimated Value: $417,534 - $450,000
3
Beds
3
Baths
2,259
Sq Ft
$193/Sq Ft
Est. Value
About This Home
This home is located at 1312 Briar Dr, Bedford, TX 76022 and is currently estimated at $436,634, approximately $193 per square foot. 1312 Briar Dr is a home located in Tarrant County with nearby schools including Stonegate Elementary School, Central J High School, and L.D. Bell High School.
Ownership History
Date
Name
Owned For
Owner Type
Purchase Details
Closed on
Feb 6, 2015
Sold by
Fannie Mae
Bought by
Violante Raymond M
Current Estimated Value
Home Financials for this Owner
Home Financials are based on the most recent Mortgage that was taken out on this home.
Original Mortgage
$221,681
Outstanding Balance
$170,602
Interest Rate
3.89%
Mortgage Type
VA
Estimated Equity
$266,032
Purchase Details
Closed on
Aug 6, 2014
Sold by
Morrison Dorothy A
Bought by
Federal National Mortgage Association and Fannie Mae
Purchase Details
Closed on
Aug 20, 2010
Sold by
Morrison Dorothy A
Bought by
Morrison Dorothy A
Purchase Details
Closed on
Oct 22, 2003
Sold by
Morrison Dorothy A
Bought by
Morrison Dorothy A and The Hoil C & Dorothy A Morrison Trust
Create a Home Valuation Report for This Property
The Home Valuation Report is an in-depth analysis detailing your home's value as well as a comparison with similar homes in the area
Home Values in the Area
Average Home Value in this Area
Purchase History
| Date | Buyer | Sale Price | Title Company |
|---|---|---|---|
| Violante Raymond M | -- | None Available | |
| Federal National Mortgage Association | $166,958 | None Available | |
| Morrison Dorothy A | -- | None Available | |
| Morrison Dorothy A | -- | -- |
Source: Public Records
Mortgage History
| Date | Status | Borrower | Loan Amount |
|---|---|---|---|
| Open | Violante Raymond M | $221,681 |
Source: Public Records
Tax History Compared to Growth
Tax History
| Year | Tax Paid | Tax Assessment Tax Assessment Total Assessment is a certain percentage of the fair market value that is determined by local assessors to be the total taxable value of land and additions on the property. | Land | Improvement |
|---|---|---|---|---|
| 2025 | $3,375 | $374,201 | $75,000 | $299,201 |
| 2024 | $3,375 | $374,201 | $75,000 | $299,201 |
| 2023 | $7,049 | $392,586 | $55,000 | $337,586 |
| 2022 | $7,297 | $345,421 | $55,000 | $290,421 |
| 2021 | $7,155 | $319,183 | $55,000 | $264,183 |
| 2020 | $6,565 | $276,117 | $55,000 | $221,117 |
| 2019 | $6,749 | $277,793 | $55,000 | $222,793 |
| 2018 | $5,020 | $254,018 | $35,000 | $219,018 |
| 2017 | $6,504 | $273,125 | $35,000 | $238,125 |
| 2016 | $5,913 | $244,422 | $35,000 | $209,422 |
| 2015 | $5,211 | $233,084 | $35,000 | $198,084 |
| 2014 | $5,211 | $207,500 | $28,000 | $179,500 |
Source: Public Records
Map
Nearby Homes
- 1213 Briar Dr
- 1204 Edgecliff Dr
- 1509 Shirley Way
- 1004 Overhill Dr
- 604 Donna Ln
- 921 Overhill Dr
- 1031 Boston Blvd
- 1416 Wade Dr
- 909 Overhill Dr
- 1108 Wade Dr
- 1701 Winchester Way
- 501 Merrill Dr
- 933 Wade Dr
- 49 Coffee Tavern Rd
- 904 Nelson Terrace
- 1236 King Dr
- 345 Somerset Cir
- 1008 Russell Ln
- 1613 Trinity Ct
- 832 Chateau Valee Cir