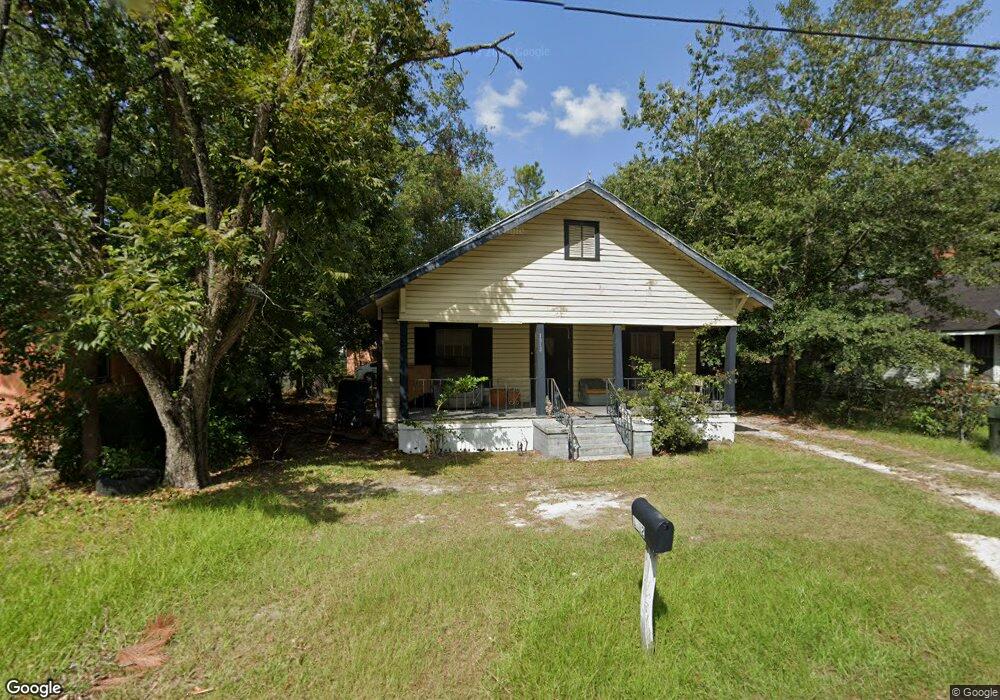
1312 Elizabeth St Waycross, GA 31503
Estimated Value: $64,433 - $101,000
--
Bed
1
Bath
1,324
Sq Ft
$62/Sq Ft
Est. Value
About This Home
This home is located at 1312 Elizabeth St, Waycross, GA 31503 and is currently estimated at $81,608, approximately $61 per square foot. 1312 Elizabeth St is a home located in Ware County with nearby schools including Waresboro Elementary School, Ware County Middle School, and Ware County High School.
Ownership History
Date
Name
Owned For
Owner Type
Purchase Details
Closed on
Aug 4, 2020
Sold by
White Aaron
Bought by
Birden Dwayne
Current Estimated Value
Purchase Details
Closed on
Jan 30, 2010
Sold by
Perfect Access Property Inc
Bought by
White Aaron and White Janice
Purchase Details
Closed on
May 23, 2006
Sold by
Perfect Access Property In
Bought by
Perfect Access Property Inc and White Janice B
Purchase Details
Closed on
Nov 14, 2005
Sold by
Thornton Judith
Bought by
Perfect Access Properties Inc
Purchase Details
Closed on
Aug 12, 1996
Sold by
Satilla Habitant For
Bought by
Hill Bennie and Hill Ruby H
Purchase Details
Closed on
May 17, 1996
Sold by
Resolution Trust Cor
Bought by
Satilla Habitant For
Purchase Details
Closed on
Jul 6, 1993
Bought by
Resolution Trust Cor
Purchase Details
Closed on
Apr 18, 1991
Bought by
Milton Gladys
Create a Home Valuation Report for This Property
The Home Valuation Report is an in-depth analysis detailing your home's value as well as a comparison with similar homes in the area
Home Values in the Area
Average Home Value in this Area
Purchase History
| Date | Buyer | Sale Price | Title Company |
|---|---|---|---|
| Birden Dwayne | $2,160 | -- | |
| White Aaron | -- | -- | |
| Perfect Access Property Inc | -- | -- | |
| Perfect Access Properties Inc | $9,000 | -- | |
| Thornton Judith | -- | -- | |
| Hill Bennie | $3,000 | -- | |
| Satilla Habitant For | -- | -- | |
| Resolution Trust Cor | $12,700 | -- | |
| Milton Gladys | -- | -- |
Source: Public Records
Tax History Compared to Growth
Tax History
| Year | Tax Paid | Tax Assessment Tax Assessment Total Assessment is a certain percentage of the fair market value that is determined by local assessors to be the total taxable value of land and additions on the property. | Land | Improvement |
|---|---|---|---|---|
| 2024 | $650 | $17,030 | $1,036 | $15,994 |
| 2023 | $587 | $18,134 | $732 | $17,402 |
| 2022 | $723 | $18,134 | $732 | $17,402 |
| 2021 | $598 | $13,829 | $732 | $13,097 |
| 2020 | $594 | $13,636 | $732 | $12,904 |
| 2019 | $496 | $11,221 | $732 | $10,489 |
| 2018 | $479 | $10,738 | $732 | $10,006 |
| 2017 | $468 | $10,738 | $732 | $10,006 |
| 2016 | $468 | $10,738 | $732 | $10,006 |
| 2015 | $471 | $10,737 | $732 | $10,006 |
| 2014 | $471 | $10,737 | $732 | $10,006 |
| 2013 | -- | $9,349 | $731 | $8,617 |
Source: Public Records
Map
Nearby Homes
- 1322 Jane St
- 0 S Georgia Pkwy W
- 0 Camp Branch Cross Rd Unit 12958956
- 0 Camp Branch Cross Rd Unit 147575
- 0 Camp Branch Cross Rd Unit 10127958
- 1401 Carswell Ave
- 6905 Kendal Ct
- 1208 Margaret St
- 00 Roosevelt St
- 605 Walker St
- 1125 Georgia St
- 1103 Ann St
- 503 N Nicholls St
- 1003 Carswell Ave
- 505 N Nicholls St
- 601 N Nicholls St
- 1006 Roosevelt St
- 506 McDonald St
- 803 Elizabeth St
- 516 Folks St
- 1314 Elizabeth St
- 1310 Elizabeth St
- 1315 Mary St
- 1319 Mary St
- 1316 Elizabeth St
- 1311 Elizabeth St
- 1306 Elizabeth St
- 1315 Elizabeth St
- 1321 Mary St
- 1307 Mary St
- 1333 Mary St
- 1318 Jane St
- 1322 Elizabeth St
- 1310 Jane St
- 1316 Jane St
- 1302 Elizabeth St
- 305 N Crawford St
- 1312 Jane St
- 1314 Mary St
- 1310 Mary St