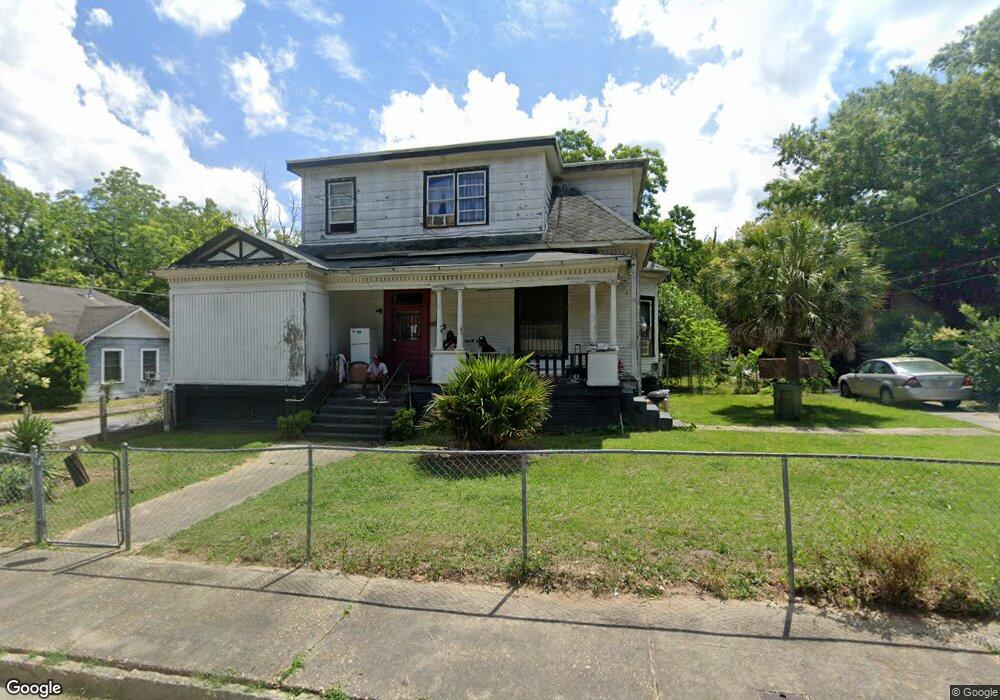
1312 Holt Ave Macon, GA 31204
Napier Heights Historic District NeighborhoodEstimated Value: $114,000 - $123,000
5
Beds
2
Baths
3,618
Sq Ft
$32/Sq Ft
Est. Value
About This Home
This home is located at 1312 Holt Ave, Macon, GA 31204 and is currently estimated at $117,000, approximately $32 per square foot. 1312 Holt Ave is a home located in Bibb County with nearby schools including Williams Elementary School, Miller Fine Arts Magnet Middle School, and Central High School.
Ownership History
Date
Name
Owned For
Owner Type
Purchase Details
Closed on
Apr 9, 2014
Sold by
Smith Kimberly
Bought by
Patrick Milton
Current Estimated Value
Purchase Details
Closed on
Jul 29, 2011
Sold by
Federal Home Loan Mortgage Corporation
Bought by
Smith Kimberly
Purchase Details
Closed on
Jul 6, 2010
Sold by
Carvin Rosie V and Carvin Aldene
Bought by
Everhome Mortgage Company
Create a Home Valuation Report for This Property
The Home Valuation Report is an in-depth analysis detailing your home's value as well as a comparison with similar homes in the area
Home Values in the Area
Average Home Value in this Area
Purchase History
| Date | Buyer | Sale Price | Title Company |
|---|---|---|---|
| Patrick Milton | -- | None Available | |
| Smith Kimberly | $11,500 | None Available | |
| Everhome Mortgage Company | $15,100 | -- | |
| Federal Home Loan Mortgage Corp | $15,146 | None Available | |
| Everhome Mortgage Company | $15,146 | None Available |
Source: Public Records
Tax History Compared to Growth
Tax History
| Year | Tax Paid | Tax Assessment Tax Assessment Total Assessment is a certain percentage of the fair market value that is determined by local assessors to be the total taxable value of land and additions on the property. | Land | Improvement |
|---|---|---|---|---|
| 2025 | $930 | $37,835 | $4,590 | $33,245 |
| 2024 | $931 | $36,645 | $3,400 | $33,245 |
| 2023 | $931 | $36,645 | $3,400 | $33,245 |
| 2022 | $846 | $24,440 | $2,874 | $21,566 |
| 2021 | $766 | $20,161 | $2,737 | $17,424 |
| 2020 | $519 | $13,362 | $2,464 | $10,898 |
| 2019 | $953 | $24,333 | $2,737 | $21,596 |
| 2018 | $1,639 | $24,333 | $2,737 | $21,596 |
| 2017 | $912 | $24,333 | $2,737 | $21,596 |
| 2016 | $842 | $24,333 | $2,737 | $21,596 |
| 2015 | $1,192 | $24,333 | $2,737 | $21,596 |
| 2014 | $1,370 | $24,333 | $2,737 | $21,596 |
Source: Public Records
Map
Nearby Homes