Estimated Value: $384,177 - $414,000
4
Beds
3
Baths
2,356
Sq Ft
$171/Sq Ft
Est. Value
About This Home
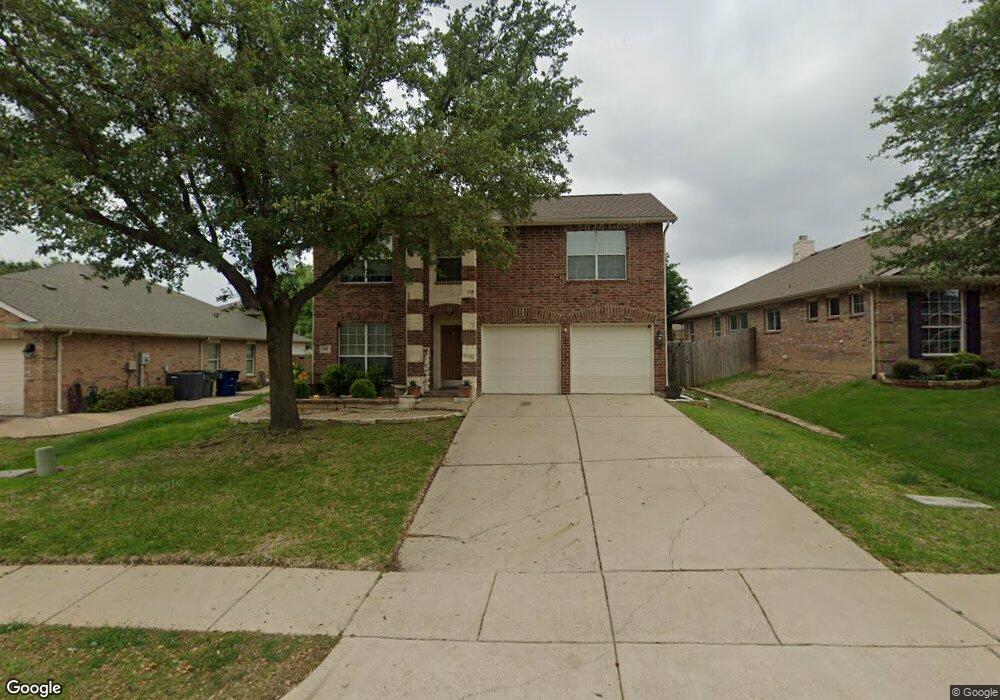
This home is located at 1312 Iron Horse St, Wylie, TX 75098 and is currently estimated at $402,294, approximately $170 per square foot. 1312 Iron Horse St is a home located in Collin County with nearby schools including Wally Watkins Elementary School, AB Harrison Intermediate School, and Grady Burnett J High School.
Ownership History
Date
Name
Owned For
Owner Type
Purchase Details
Closed on
Jun 15, 2020
Sold by
Hamilton Sean and Ford Jennifer
Bought by
Brubaker Denise
Current Estimated Value
Home Financials for this Owner
Home Financials are based on the most recent Mortgage that was taken out on this home.
Original Mortgage
$279,837
Outstanding Balance
$248,054
Interest Rate
3.2%
Mortgage Type
FHA
Estimated Equity
$154,240
Purchase Details
Closed on
Dec 4, 2014
Sold by
Price Brian and Price Jennifer
Bought by
Hamilton Sean and Ford Jennifer
Home Financials for this Owner
Home Financials are based on the most recent Mortgage that was taken out on this home.
Original Mortgage
$199,500
Interest Rate
3.93%
Mortgage Type
New Conventional
Purchase Details
Closed on
Aug 9, 2005
Sold by
First Mortgage Of America Ltd
Bought by
Price Brian
Home Financials for this Owner
Home Financials are based on the most recent Mortgage that was taken out on this home.
Original Mortgage
$175,221
Interest Rate
5.65%
Create a Home Valuation Report for This Property
The Home Valuation Report is an in-depth analysis detailing your home's value as well as a comparison with similar homes in the area
Home Values in the Area
Average Home Value in this Area
Purchase History
| Date | Buyer | Sale Price | Title Company |
|---|---|---|---|
| Brubaker Denise | -- | Capital Title | |
| Hamilton Sean | -- | Chicago Title | |
| Price Brian | -- | -- |
Source: Public Records
Mortgage History
| Date | Status | Borrower | Loan Amount |
|---|---|---|---|
| Open | Brubaker Denise | $279,837 | |
| Previous Owner | Hamilton Sean | $199,500 | |
| Previous Owner | Price Brian | $175,221 |
Source: Public Records
Tax History Compared to Growth
Tax History
| Year | Tax Paid | Tax Assessment Tax Assessment Total Assessment is a certain percentage of the fair market value that is determined by local assessors to be the total taxable value of land and additions on the property. | Land | Improvement |
|---|---|---|---|---|
| 2025 | $5,962 | $395,357 | $105,000 | $290,357 |
| 2024 | $5,962 | $367,819 | $105,000 | $285,776 |
| 2023 | $5,962 | $334,381 | $95,000 | $280,000 |
| 2022 | $6,669 | $303,983 | $95,000 | $255,464 |
| 2021 | $6,502 | $276,348 | $70,000 | $206,348 |
| 2020 | $6,636 | $267,265 | $60,000 | $207,265 |
| 2019 | $6,884 | $261,968 | $60,000 | $201,968 |
| 2018 | $6,851 | $254,410 | $60,000 | $194,410 |
| 2017 | $6,389 | $238,023 | $50,000 | $188,023 |
| 2016 | $5,993 | $215,689 | $40,000 | $175,689 |
| 2015 | $4,475 | $194,848 | $40,000 | $154,848 |
Source: Public Records
Map
Nearby Homes
- 1321 Iron Horse St
- 1318 Chestnut Hill Dr
- 1320 Cedar Branch Dr
- 1323 Canyon Creek Rd
- 1210 Iron Horse St
- 1330 Canyon Creek Rd
- 1316 Taren Trail
- 1318 Taren Trail
- 1201 E Stone Rd
- 1503 E Collins Blvd
- 407 Sparrow Dr
- 1210 Troy Rd
- 1613 Saddle Ridge Dr
- 312 Maltese Cir
- 1605 Roberts Ravine Rd
- 306 Foxwood Ct
- 1725 Crescent Oak St
- 1115 Nighthawk Dr
- 1209 Surrey Cir
- 1610 Deer Field Ln
- 1310R Iron Horse St
- 1310 Iron Horse St
- 1314 Iron Horse St
- 1308 Iron Horse St
- 1309 Valley Stream Dr
- 1311 Valley Stream Dr
- 1307 Valley Stream Dr
- 1317 Valley Stream Dr
- 1306 Iron Horse St
- 1319 Iron Horse St
- 1331 Valley Stream Dr
- 1327 Valley Stream Dr
- 1317 Iron Horse St
- 1315 Valley Stream Dr
- 1315 Iron Horse St
- 1313 Iron Horse St
- 1304 Iron Horse St
- 1313 Valley Stream Dr
- 1311 Iron Horse St
- 1303 Valley Stream Dr