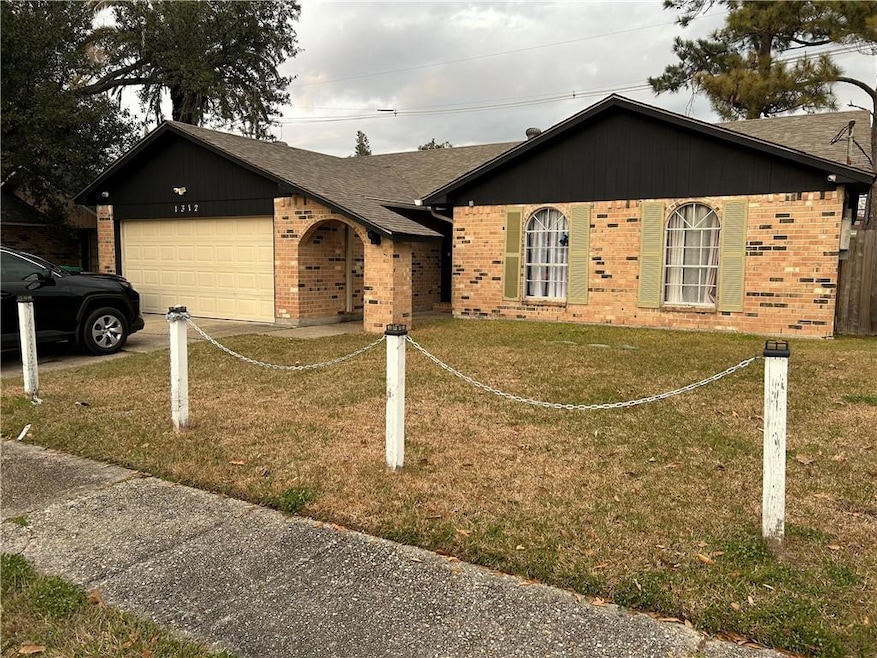
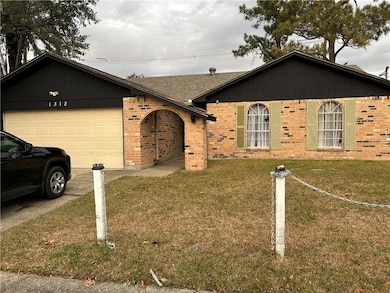
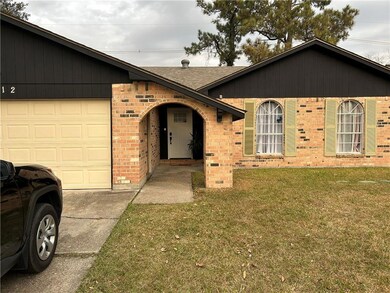
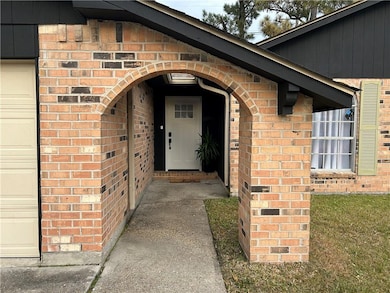

1312 N Sugar Ridge Rd La Place, LA 70068
Laplace Neighborhood
3
Beds
2
Baths
1,403
Sq Ft
5,968
Sq Ft Lot
Highlights
- Cathedral Ceiling
- Granite Countertops
- Central Heating and Cooling System
- Traditional Architecture
- Fireplace
- Ceiling Fan
About This Home
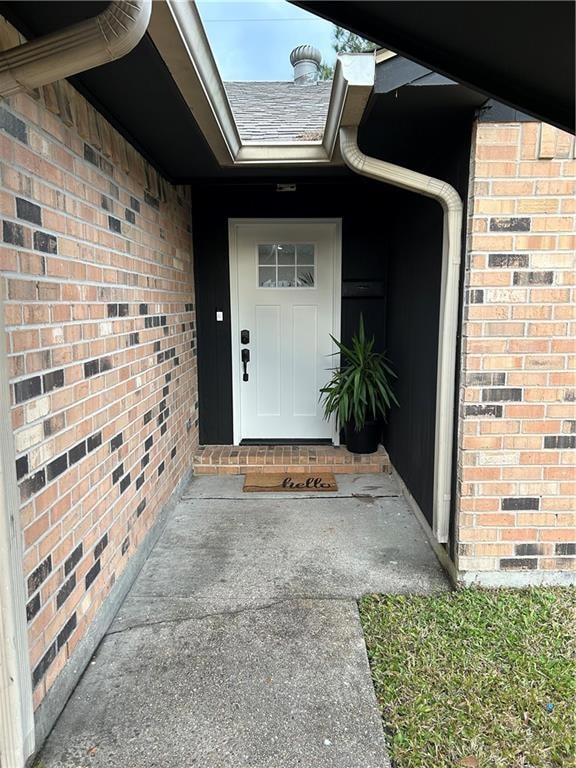
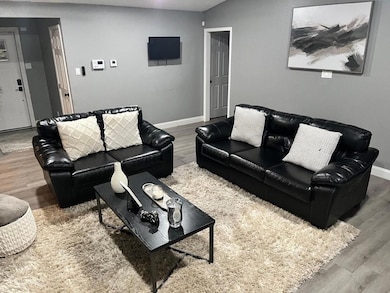
Cathedral ceilings in Living Room with fire place and door leading to the cover patio. Kitchen has smooth top stove; ceiling fans in every bedroom. Bathrooms are beautiful. Plenty of storage; 2 car garage. There's plenty of storage; utility room is spacious. Back yard is large, waiting for you to enjoy. Come view this house at your convenience.
Home Details
Home Type
- Single Family
Est. Annual Taxes
- $2,105
Year Built
- Built in 1981
Lot Details
- Lot Dimensions are 60 x 100
- Fenced
- Rectangular Lot
Parking
- 2 Car Garage
Home Design
- Traditional Architecture
- Brick Exterior Construction
- Slab Foundation
Interior Spaces
- 1,403 Sq Ft Home
- 1-Story Property
- Cathedral Ceiling
- Ceiling Fan
- Fireplace
- Fire and Smoke Detector
- Washer and Dryer Hookup
Kitchen
- Oven
- Range
- Microwave
- Dishwasher
- Granite Countertops
Bedrooms and Bathrooms
- 3 Bedrooms
- 2 Full Bathrooms
Location
- City Lot
Utilities
- Central Heating and Cooling System
- Cable TV Available
Community Details
- Breed Restrictions
Listing and Financial Details
- Security Deposit $1,750
- Tenant pays for electricity, water
- Tax Lot 240
- Assessor Parcel Number 381
Map
Source: ROAM MLS
MLS Number: 2532664
APN: 0470012523
Nearby Homes
- 1408 N Sugar Ridge Rd
- 1813 Meeker Loop
- 0 Heather Ln
- 1501 Bayonne Dr
- 1707 Chantilly Dr
- 212 W Lakeview Dr
- 1609 Bayonne Dr
- 1828 San Francisco Dr
- 145 Lakewood Dr
- 324 Elmwood Dr
- 2001 van Arpel Dr
- 308 Arlington Dr
- 2013 van Arpel Dr
- 302 Magnolia Ave
- 430 Belle Terre Blvd
- Lot 15 Magnolia Ave
- 1012 Carrollwood Dr
- 0 W Airline Hwy
- 243 Belle Terre Blvd Unit B
- 243 Belle Terre Blvd Unit A
- 1416 N Sugar Ridge Rd
- 231 Belle Terre Blvd Unit B
- 201 Bayonne Dr Unit A
- 201 Bayonne Dr Unit B
- 209 Lenzie Dr Unit B
- 359 Belle Terre Blvd Unit 2
- 1808 Helvetia Ct
- 2001 van Arpel Dr
- 302 Magnolia Ave
- 468 Elm St
- 324 Camelia Ave Unit 2
- 110 Pennbrooke Dr
- 373 Greenwood Dr
- 1601 Marseille Dr
- 908 Jeffrey Ct
- 101 Ormond Blvd
- 557 Esplanade St
- 111 Madere Ln
