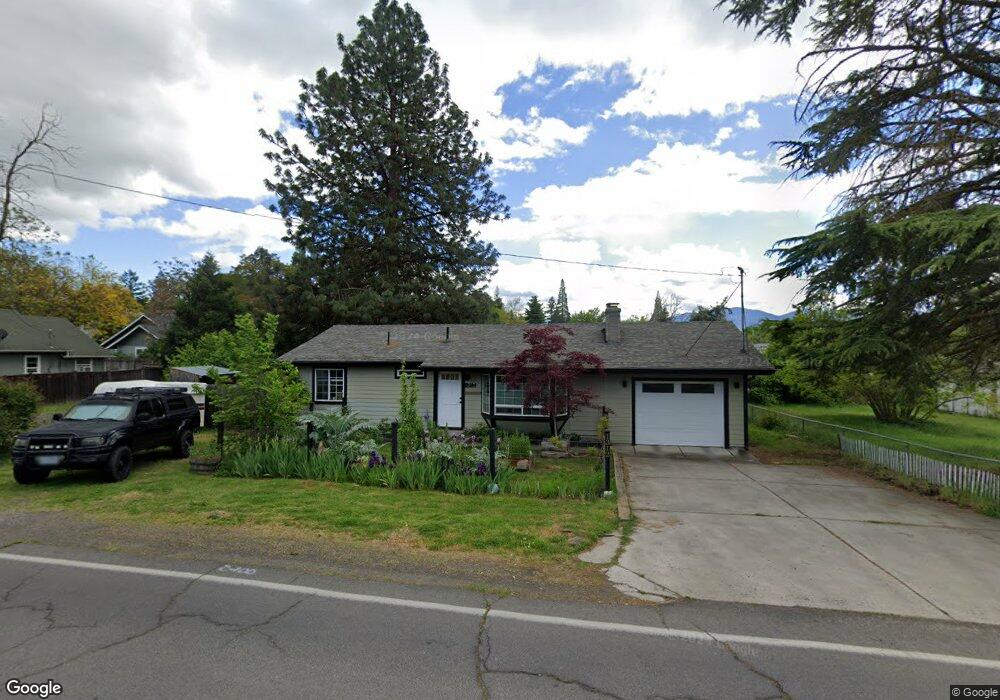
1312 Spring St Medford, OR 97504
College Hill NeighborhoodEstimated Value: $284,000 - $315,000
2
Beds
2
Baths
988
Sq Ft
$302/Sq Ft
Est. Value
About This Home
This home is located at 1312 Spring St, Medford, OR 97504 and is currently estimated at $298,813, approximately $302 per square foot. 1312 Spring St is a home located in Jackson County with nearby schools including Wilson Elementary School, Hedrick Middle School, and North Medford High School.
Ownership History
Date
Name
Owned For
Owner Type
Purchase Details
Closed on
Aug 26, 2009
Sold by
Us Bank Na
Bought by
Macinnis Dean D and Macinnis Jenna L
Current Estimated Value
Home Financials for this Owner
Home Financials are based on the most recent Mortgage that was taken out on this home.
Original Mortgage
$97,850
Interest Rate
5.02%
Mortgage Type
New Conventional
Purchase Details
Closed on
Jul 1, 2009
Sold by
Gallegos Jose Ayala
Bought by
Us Bank Na
Home Financials for this Owner
Home Financials are based on the most recent Mortgage that was taken out on this home.
Original Mortgage
$97,850
Interest Rate
5.02%
Mortgage Type
New Conventional
Purchase Details
Closed on
May 16, 2005
Sold by
Hunter Patricia
Bought by
Gallegos Jose Ayala
Home Financials for this Owner
Home Financials are based on the most recent Mortgage that was taken out on this home.
Original Mortgage
$140,450
Interest Rate
5.87%
Mortgage Type
FHA
Create a Home Valuation Report for This Property
The Home Valuation Report is an in-depth analysis detailing your home's value as well as a comparison with similar homes in the area
Home Values in the Area
Average Home Value in this Area
Purchase History
| Date | Buyer | Sale Price | Title Company |
|---|---|---|---|
| Macinnis Dean D | $103,000 | First American | |
| Us Bank Na | $83,312 | None Available | |
| Gallegos Jose Ayala | $175,570 | First American Title |
Source: Public Records
Mortgage History
| Date | Status | Borrower | Loan Amount |
|---|---|---|---|
| Previous Owner | Macinnis Dean D | $97,850 | |
| Previous Owner | Gallegos Jose Ayala | $140,450 | |
| Closed | Gallegos Jose Ayala | $26,300 |
Source: Public Records
Tax History Compared to Growth
Tax History
| Year | Tax Paid | Tax Assessment Tax Assessment Total Assessment is a certain percentage of the fair market value that is determined by local assessors to be the total taxable value of land and additions on the property. | Land | Improvement |
|---|---|---|---|---|
| 2025 | $2,098 | $144,670 | $105,490 | $39,180 |
| 2024 | $2,098 | $140,460 | $102,420 | $38,040 |
| 2023 | $2,034 | $136,370 | $99,440 | $36,930 |
| 2022 | $1,984 | $136,370 | $99,440 | $36,930 |
| 2021 | $1,933 | $132,400 | $96,550 | $35,850 |
| 2020 | $1,892 | $128,550 | $93,740 | $34,810 |
| 2019 | $1,848 | $121,180 | $88,360 | $32,820 |
| 2018 | $1,800 | $117,660 | $85,800 | $31,860 |
| 2017 | $1,768 | $117,660 | $85,800 | $31,860 |
| 2016 | $1,780 | $110,920 | $80,890 | $30,030 |
| 2015 | $1,711 | $110,920 | $80,890 | $30,030 |
| 2014 | $1,680 | $104,560 | $76,250 | $28,310 |
Source: Public Records
Map
Nearby Homes
- 1221 Skeeters Ln
- 1167 Skeeters Ln
- 1533 Lenora Dr
- 529 Pearl St
- 528 Pearl St
- 1111 Stevens St Unit 1
- 522 Pearl St
- 535 Effie St
- 1560 Cambridge Cir
- 533 Effie St
- 531 Effie St
- 1400 Avocado Ln
- 1417 Larkspur Ave
- 1472 N Keene Way Dr
- 1536 Oleander St
- 313 Marie St
- 200 Oregon Terrace
- 312 N Barneburg Rd
- 1800 Crater Lake Ave Unit 9
- 1228 Corona Ave
- 1320 Spring St
- 1304 Spring St
- 928 Wabash Ave
- 920 Wabash Ave
- 1332 Spring St
- 1326 Spring St
- 1316 Spring St
- 912 Wabash Ave
- 1338 Spring St
- 1301 Spring St
- 91315 Wabash Ave
- 1319 Spring St
- 1325 Spring St
- 904 Wabash Ave
- 1334 Lawnridge St
- 1347 Lawnridge St
- 1333 Spring St
- 1342 Spring St
- 1337 Spring St
- 1262 Spring St