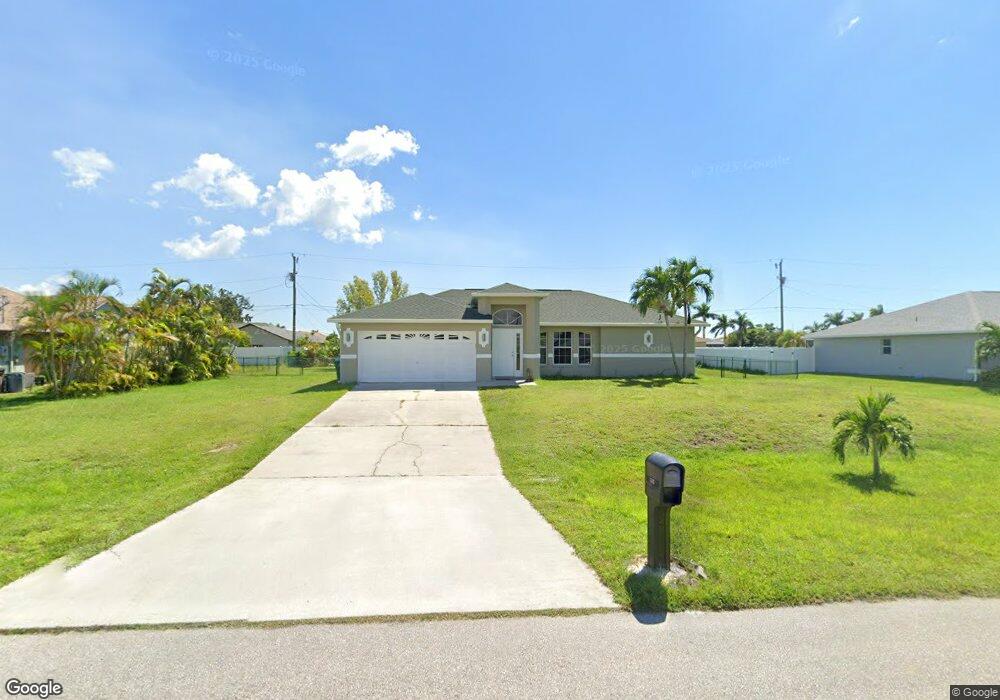
1312 SW 43rd Ln Cape Coral, FL 33914
Pelican NeighborhoodEstimated Value: $306,164 - $401,000
3
Beds
2
Baths
1,481
Sq Ft
$234/Sq Ft
Est. Value
About This Home
This home is located at 1312 SW 43rd Ln, Cape Coral, FL 33914 and is currently estimated at $346,791, approximately $234 per square foot. 1312 SW 43rd Ln is a home located in Lee County with nearby schools including Cape Elementary School, Caloosa Elementary School, and Tropic Isles Elementary School.
Ownership History
Date
Name
Owned For
Owner Type
Purchase Details
Closed on
Dec 27, 2023
Sold by
Ferario Thomas and Ferario Kimberly
Bought by
Bryan Michael J and Bryan Tammy L
Current Estimated Value
Purchase Details
Closed on
Mar 21, 2011
Sold by
Arch Bay Holdings Llc
Bought by
Ferario Thomas and Ferrario Kimberly
Purchase Details
Closed on
Jan 12, 2011
Sold by
Homeeq Servicing
Bought by
Arch Bay Holdings Llc Series 2009B
Purchase Details
Closed on
Jul 30, 2008
Sold by
Conidaris Robert A and Conidaris Melissa
Bought by
Homeeq Servicing
Purchase Details
Closed on
Mar 10, 2004
Sold by
Henneberry Brian T and Henneberry Meghan
Bought by
Conidaris Robert A and Conidaris Melissa
Home Financials for this Owner
Home Financials are based on the most recent Mortgage that was taken out on this home.
Original Mortgage
$126,000
Interest Rate
5.62%
Mortgage Type
Unknown
Purchase Details
Closed on
Aug 18, 1999
Sold by
Brainerd Thomas E and Hines Joseph P
Bought by
Hennebary Brian and Hennebary Meghan
Create a Home Valuation Report for This Property
The Home Valuation Report is an in-depth analysis detailing your home's value as well as a comparison with similar homes in the area
Home Values in the Area
Average Home Value in this Area
Purchase History
| Date | Buyer | Sale Price | Title Company |
|---|---|---|---|
| Bryan Michael J | $100 | New Guavarty Title | |
| Bryan Michael J | $100 | None Listed On Document | |
| Ferario Thomas | $70,000 | Newman Guaranty Title Ins In | |
| Arch Bay Holdings Llc Series 2009B | -- | Attorney | |
| Homeeq Servicing | -- | None Available | |
| Conidaris Robert A | $140,000 | Able Title Professionals Inc | |
| Hennebary Brian | $5,000 | -- |
Source: Public Records
Mortgage History
| Date | Status | Borrower | Loan Amount |
|---|---|---|---|
| Previous Owner | Conidaris Robert A | $126,000 |
Source: Public Records
Tax History Compared to Growth
Tax History
| Year | Tax Paid | Tax Assessment Tax Assessment Total Assessment is a certain percentage of the fair market value that is determined by local assessors to be the total taxable value of land and additions on the property. | Land | Improvement |
|---|---|---|---|---|
| 2025 | $5,826 | $225,367 | $90,279 | $132,378 |
| 2024 | $5,826 | $267,558 | $109,962 | $154,198 |
| 2023 | $6,034 | $213,894 | $0 | $0 |
| 2022 | $5,549 | $194,449 | $0 | $0 |
| 2021 | $5,096 | $177,175 | $44,649 | $132,526 |
| 2020 | $4,729 | $160,702 | $34,500 | $126,202 |
| 2019 | $4,549 | $152,608 | $34,500 | $118,108 |
| 2018 | $4,603 | $153,424 | $28,750 | $124,674 |
| 2017 | $4,476 | $150,188 | $23,000 | $127,188 |
| 2016 | $4,279 | $135,004 | $25,212 | $109,792 |
| 2015 | $4,018 | $113,899 | $19,503 | $94,396 |
| 2014 | $3,842 | $105,403 | $17,918 | $87,485 |
| 2013 | -- | $94,805 | $14,714 | $80,091 |
Source: Public Records
Map
Nearby Homes
- 2303 SW 43rd Terrace
- 4402 SW 12th Place
- 1157 SW 44th St
- 4425 SW 14th Ave
- 4424 SW 13th Ave
- 1300 SW 43rd St
- 4426 SW 14th Ave
- 4432 SW 14th Ave
- 1156 SW 44th Terrace
- 4413 SW 15th Place
- 1518 SW 43rd Ln
- 4404 SW 15th Place
- 1515 SW 43rd Terrace
- 1521 SW 43rd Ln
- 4436 SW 15th Ave
- 4213 SW 15th Ave
- 4531 SW 15th Ave
- 4207 SW 13th Ave
- 1151 SW 45th Terrace
- 4333 SW 16th Place
- 1306 SW 43rd Ln
- 1402 SW 43rd Ln
- 1311 SW 44th St
- 1315 SW 44th St
- 1307 SW 44th St
- 1302 SW 43rd Ln
- 1406 SW 43rd Ln
- 1311 SW 43rd Ln
- 1315 SW 43rd Ln
- 1307 SW 43rd Ln
- 1303 SW 44th St
- 1403 SW 43rd Ln
- 1407 SW 44th St
- 1303 SW 43rd Ln
- 1410 SW 43rd Ln
- 1407 SW 43rd Ln
- 4403 SW 14th Ave
- 1314 SW 43rd Terrace Unit 65
- 1310 SW 43rd Terrace
- 1411 SW 44th St