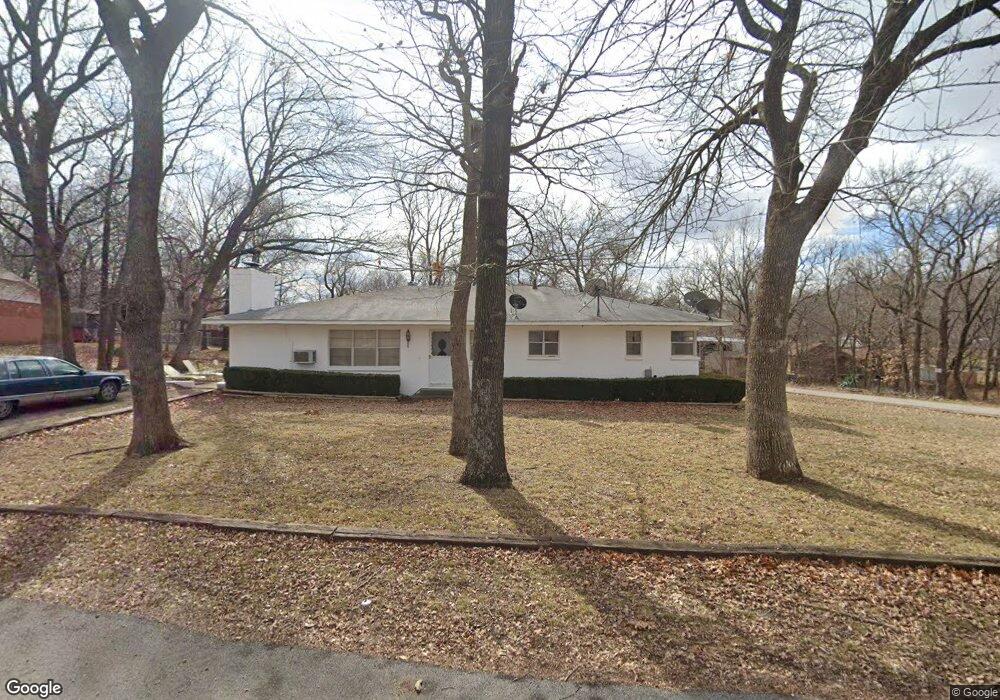
13121 S Redbud St Claremore, OK 74017
Estimated Value: $151,694 - $216,000
3
Beds
2
Baths
1,248
Sq Ft
$151/Sq Ft
Est. Value
About This Home
This home is located at 13121 S Redbud St, Claremore, OK 74017 and is currently estimated at $188,924, approximately $151 per square foot. 13121 S Redbud St is a home located in Rogers County with nearby schools including Sequoyah Elementary School and Sequoyah High School.
Ownership History
Date
Name
Owned For
Owner Type
Purchase Details
Closed on
Sep 21, 2007
Sold by
Oldham Mary and Oldham Gordon R
Bought by
Oldham Mary and Oldham Gordon R
Current Estimated Value
Purchase Details
Closed on
Mar 14, 2005
Sold by
Kell Mary Louise and Kell Mary L
Bought by
Oldham Mary
Create a Home Valuation Report for This Property
The Home Valuation Report is an in-depth analysis detailing your home's value as well as a comparison with similar homes in the area
Home Values in the Area
Average Home Value in this Area
Purchase History
| Date | Buyer | Sale Price | Title Company |
|---|---|---|---|
| Oldham Mary | -- | None Available | |
| Oldham Mary | -- | None Available |
Source: Public Records
Tax History Compared to Growth
Tax History
| Year | Tax Paid | Tax Assessment Tax Assessment Total Assessment is a certain percentage of the fair market value that is determined by local assessors to be the total taxable value of land and additions on the property. | Land | Improvement |
|---|---|---|---|---|
| 2025 | $444 | $6,060 | $1,926 | $4,134 |
| 2024 | $445 | $6,060 | $1,837 | $4,223 |
| 2023 | $445 | $6,060 | $1,520 | $4,540 |
| 2022 | $456 | $6,060 | $1,517 | $4,543 |
| 2021 | $440 | $6,060 | $1,317 | $4,743 |
| 2020 | $455 | $6,060 | $1,305 | $4,755 |
| 2019 | $450 | $6,060 | $1,356 | $4,704 |
| 2018 | $454 | $6,060 | $1,303 | $4,757 |
| 2017 | $441 | $6,060 | $1,313 | $4,747 |
| 2016 | $446 | $6,060 | $1,363 | $4,697 |
| 2015 | $422 | $6,060 | $1,390 | $4,670 |
| 2014 | $445 | $6,060 | $1,341 | $4,719 |
Source: Public Records
Map
Nearby Homes
- 9666 E Sycamore St
- 13192 S Hickory St
- 13525 S Grande Pointe Pkwy
- 9885 E Mesa Dr
- 40 S 4110 Rd
- 15750 S Old Highway 88
- 10922 E Canyon Oaks Blvd
- 000 HWY 88
- 7 E 420
- S S 4110 Rd
- 9462 E Yorkshire Ave
- 7425 E Oologah Place
- 213 E Sunday Ave
- 0 S 4130 Rd
- 0 S Pine St
- 206 N Will Rogers Loop E
- 405 Will Rogers Loop E
- 226 Price Ave
- 10192 E 445 Rd
- 10308 E 445 Rd
- 13122 S Ash St
- 21204 E Redbud St
- 13133 S Redbud St
- 12804 S Ash St
- 12806 S Ash St
- 9611 E Redbud St
- 13142 S Redbud St
- 12803 S Ash St
- 12805 S Ash St
- 9653 E Redbud St
- 9503 E Pecan St
- 13155 S Redbud St
- 13125 S Ash St
- 0 E Dogwood St
- 9592 E Dogwood St
- 13196 S Ash St
- 9600 E Dogwood St
- 0 Redbud St Unit 926100
- 0 Redbud St Unit 902420
- 0 Redbud St Unit 2110796