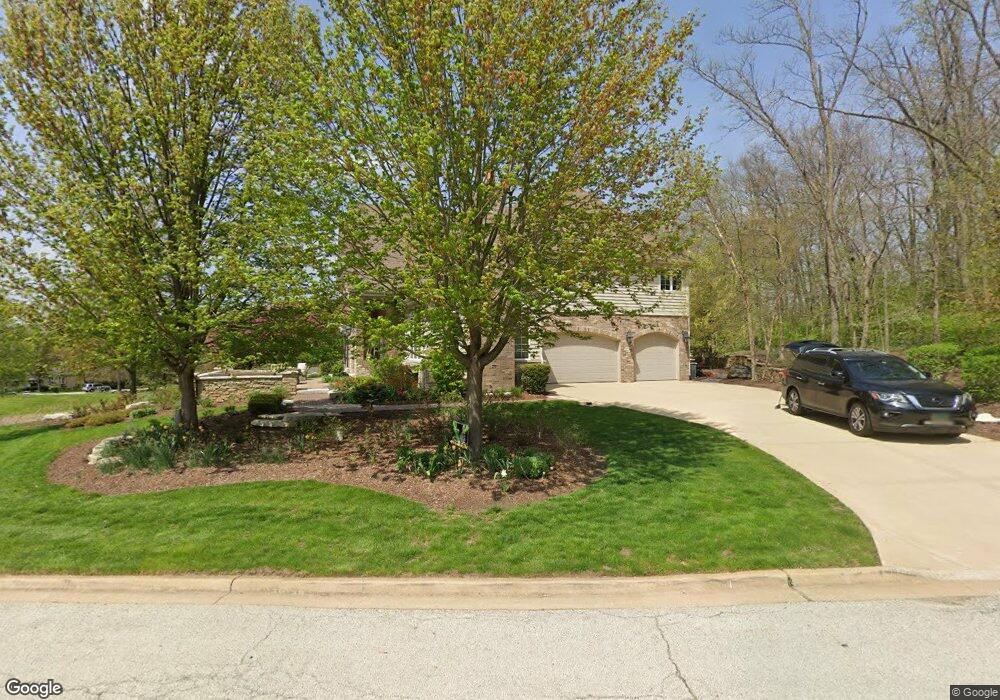
13124 Steeplechase Dr New Lenox, IL 60451
Estimated Value: $773,000 - $1,039,981
4
Beds
4
Baths
4,200
Sq Ft
$220/Sq Ft
Est. Value
About This Home
This home is located at 13124 Steeplechase Dr, New Lenox, IL 60451 and is currently estimated at $923,327, approximately $219 per square foot. 13124 Steeplechase Dr is a home located in Will County with nearby schools including Spencer Trail, Spencer Crossing Intermediate School, and Spencer Pointe.
Ownership History
Date
Name
Owned For
Owner Type
Purchase Details
Closed on
Oct 24, 2008
Sold by
Des Development Inc
Bought by
Farry Christopher P and Farry Andrea D
Current Estimated Value
Home Financials for this Owner
Home Financials are based on the most recent Mortgage that was taken out on this home.
Original Mortgage
$417,000
Outstanding Balance
$267,807
Interest Rate
5.73%
Mortgage Type
Purchase Money Mortgage
Estimated Equity
$655,520
Purchase Details
Closed on
Jun 30, 2006
Sold by
Steeplechase Estates Llc
Bought by
Des Development Inc
Home Financials for this Owner
Home Financials are based on the most recent Mortgage that was taken out on this home.
Original Mortgage
$860,000
Interest Rate
6.72%
Mortgage Type
Construction
Create a Home Valuation Report for This Property
The Home Valuation Report is an in-depth analysis detailing your home's value as well as a comparison with similar homes in the area
Home Values in the Area
Average Home Value in this Area
Purchase History
| Date | Buyer | Sale Price | Title Company |
|---|---|---|---|
| Farry Christopher P | $799,000 | Chicago Title Insurance Co | |
| Des Development Inc | $265,000 | Prairie Title |
Source: Public Records
Mortgage History
| Date | Status | Borrower | Loan Amount |
|---|---|---|---|
| Open | Farry Christopher P | $417,000 | |
| Previous Owner | Des Development Inc | $860,000 |
Source: Public Records
Tax History Compared to Growth
Tax History
| Year | Tax Paid | Tax Assessment Tax Assessment Total Assessment is a certain percentage of the fair market value that is determined by local assessors to be the total taxable value of land and additions on the property. | Land | Improvement |
|---|---|---|---|---|
| 2024 | $24,778 | $324,679 | $136,445 | $188,234 |
| 2023 | $24,778 | $295,970 | $124,380 | $171,590 |
| 2022 | $22,242 | $272,658 | $114,583 | $158,075 |
| 2021 | $21,163 | $256,427 | $107,762 | $148,665 |
| 2020 | $20,891 | $247,278 | $103,917 | $143,361 |
| 2019 | $19,710 | $239,611 | $100,695 | $138,916 |
| 2018 | $19,275 | $231,352 | $97,224 | $134,128 |
| 2017 | $18,316 | $224,701 | $94,429 | $130,272 |
| 2016 | $17,796 | $218,687 | $91,902 | $126,785 |
| 2015 | $17,133 | $211,803 | $89,009 | $122,794 |
| 2014 | $17,133 | $209,188 | $87,910 | $121,278 |
| 2013 | $17,133 | $212,008 | $89,095 | $122,913 |
Source: Public Records
Map
Nearby Homes
- 1108 Plaza Dr
- 12932 Carrington Ct
- 821 Chatfield Rd
- 1931 Tessington Ct
- 12752 Berkshire Dr
- 1920 Tessington Ct
- 621 Chatfield Rd
- 1261 S Regan Rd
- 1245 Georgias Way
- 1125 Georgias Way
- 1193 Georgias Way
- 1139 Georgias Way
- 1212 Georgias Way
- 0000 W Regan Rd
- 12526 Surrey Ct
- 19909 Foxborough Dr
- 12417 Lajunta Ct
- 12415 Foxborough Dr
- Lot 108 S Richard Ave
- 807 Picardy Place
- 1130 N Marley Rd
- 13112 Steeplechase Dr
- 13121 Steeplechase Dr
- 13125 Steeplechase Dr
- 1200 N Marley Rd
- 13111 Steeplechase Dr
- 1212 Lantern Ln
- 910 N Marley Rd
- 1210 N Marley Rd
- 1121 N Marley Rd
- 913 N Marley Rd
- 1131 N Marley Rd
- 1218 N Marley Rd
- 1141 N Marley Rd
- 970 N Marley Rd
- 900 N Marley Rd
- 900 N Marley Rd
- 1220 N Marley Rd
- 19850 Lantern Ln
- 1221 N Marley Rd