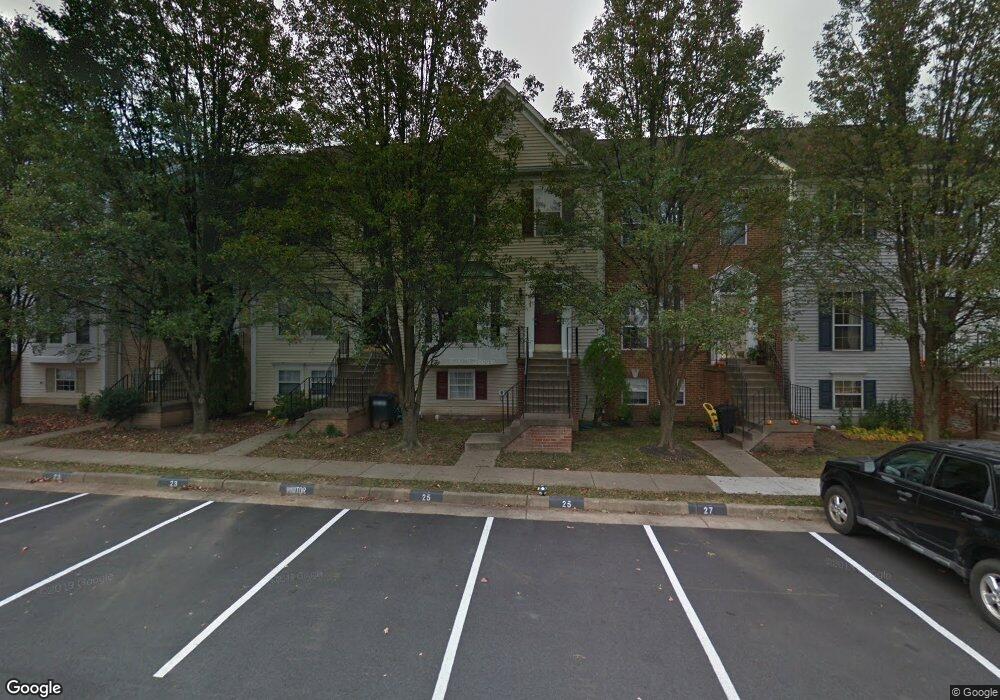
13125 Quail Creek Ln Fairfax, VA 22033
Estimated Value: $535,000 - $675,000
4
Beds
4
Baths
1,290
Sq Ft
$468/Sq Ft
Est. Value
About This Home
This home is located at 13125 Quail Creek Ln, Fairfax, VA 22033 and is currently estimated at $603,422, approximately $467 per square foot. 13125 Quail Creek Ln is a home located in Fairfax County with nearby schools including Greenbriar West Elementary School, Rocky Run Middle School, and Chantilly High School.
Ownership History
Date
Name
Owned For
Owner Type
Purchase Details
Closed on
Aug 30, 2017
Sold by
Putalapattu Sobhan and Putalapattu Sreevani
Bought by
Wu Huichuan and Wu Hui Ying
Current Estimated Value
Home Financials for this Owner
Home Financials are based on the most recent Mortgage that was taken out on this home.
Original Mortgage
$220,000
Outstanding Balance
$184,011
Interest Rate
3.96%
Mortgage Type
New Conventional
Estimated Equity
$419,411
Purchase Details
Closed on
May 14, 2004
Sold by
Smith Javon
Bought by
Putalapattu Sobhanpatu
Home Financials for this Owner
Home Financials are based on the most recent Mortgage that was taken out on this home.
Original Mortgage
$246,750
Interest Rate
5.47%
Mortgage Type
New Conventional
Purchase Details
Closed on
Jun 28, 1995
Sold by
K Hovnanian At Fair Lakes Inc
Bought by
Zapf Amy
Home Financials for this Owner
Home Financials are based on the most recent Mortgage that was taken out on this home.
Original Mortgage
$149,745
Interest Rate
7.8%
Create a Home Valuation Report for This Property
The Home Valuation Report is an in-depth analysis detailing your home's value as well as a comparison with similar homes in the area
Home Values in the Area
Average Home Value in this Area
Purchase History
| Date | Buyer | Sale Price | Title Company |
|---|---|---|---|
| Wu Huichuan | $417,500 | Fidelity National Title | |
| Putalapattu Sobhanpatu | $363,000 | -- | |
| Zapf Amy | $151,775 | -- |
Source: Public Records
Mortgage History
| Date | Status | Borrower | Loan Amount |
|---|---|---|---|
| Open | Wu Huichuan | $220,000 | |
| Previous Owner | Putalapattu Sobhanpatu | $246,750 | |
| Previous Owner | Zapf Amy | $149,745 |
Source: Public Records
Tax History Compared to Growth
Tax History
| Year | Tax Paid | Tax Assessment Tax Assessment Total Assessment is a certain percentage of the fair market value that is determined by local assessors to be the total taxable value of land and additions on the property. | Land | Improvement |
|---|---|---|---|---|
| 2025 | $5,751 | $537,050 | $162,000 | $375,050 |
| 2024 | $5,751 | $496,450 | $135,000 | $361,450 |
| 2023 | $5,564 | $493,070 | $135,000 | $358,070 |
| 2022 | $5,290 | $462,630 | $117,000 | $345,630 |
| 2021 | $5,000 | $426,100 | $113,000 | $313,100 |
| 2020 | $5,013 | $423,550 | $120,000 | $303,550 |
| 2019 | $4,704 | $397,480 | $105,000 | $292,480 |
| 2018 | $4,428 | $385,020 | $100,000 | $285,020 |
| 2017 | $4,385 | $377,700 | $95,000 | $282,700 |
| 2016 | $4,376 | $377,700 | $95,000 | $282,700 |
| 2015 | $4,061 | $363,880 | $90,000 | $273,880 |
| 2014 | $3,888 | $349,210 | $85,000 | $264,210 |
Source: Public Records
Map
Nearby Homes
- 5019 Village Fountain Place
- 4417 Fair Stone Dr Unit 104
- 4401 Sedgehurst Dr Unit 203
- 13222 Goose Pond Ln
- 5013 Devin Green Ln
- 5142 UNIT M Brittney Elyse Cir Unit M
- 4758 Warm Hearth Cir
- 13357 Connor Dr Unit F
- 5126 Brittney Elyse Cir Unit A
- 4651 Red Admiral Way Unit 157
- 5123 Travis Edward Way Unit J
- 13386 Connor Dr Unit D
- 5170 A William Colin Ct
- 4875 Annamohr Dr
- 5280 Jule Star Dr
- 13244 Maple Creek Ln
- 4618 Superior Square
- 13611 British Manor Ct
- 4603 Quartz Rock Ct
- 12887 Fair Briar Ln
- 13123 Quail Creek Ln
- 13121 Quail Creek Ln
- 13129 Quail Creek Ln
- 13119 Quail Creek Ln
- 13131 Quail Creek Ln
- 13117 Quail Creek Ln
- 13133 Quail Creek Ln
- 13115 Quail Creek Ln
- 4826 Pheasant Brook Ln
- 13135 Quail Creek Ln
- 13113 Quail Creek Ln
- 13137 Quail Creek Ln
- 4824 Pheasant Brook Ln
- 13111 Quail Creek Ln
- 13116 Quail Creek Ln
- 4822 Pheasant Brook Ln
- 13109 Quail Creek Ln
- 13139 Quail Creek Ln
- 13114 Quail Creek Ln
- 13107 Quail Creek Ln