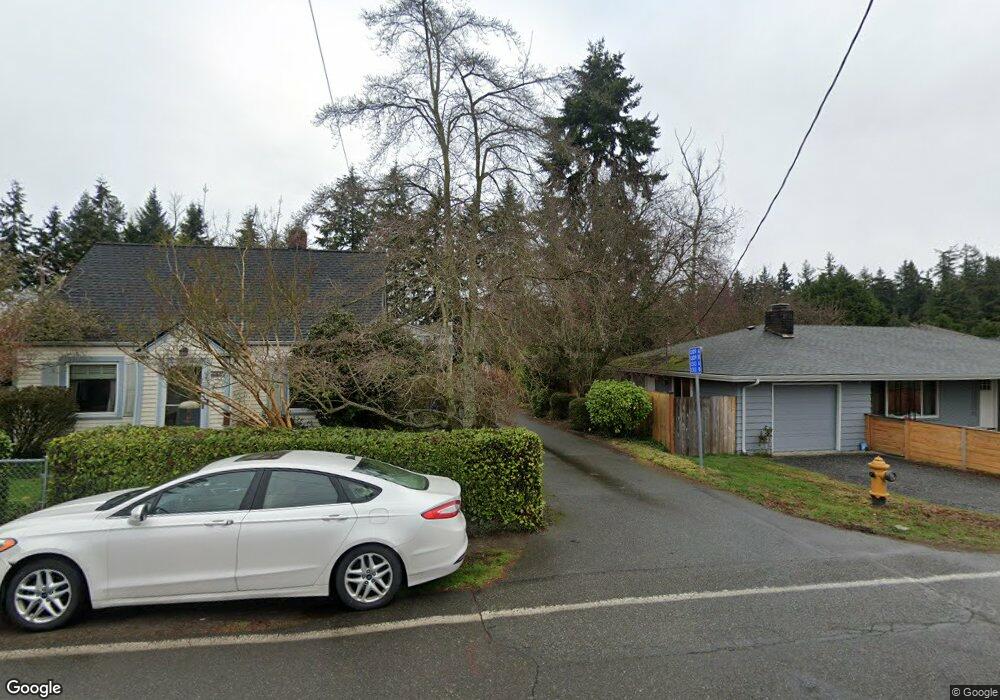
1313 63rd St SE Unit 1313A Everett, WA 98203
Pinehurst NeighborhoodEstimated Value: $492,401 - $575,000
3
Beds
3
Baths
1,500
Sq Ft
$363/Sq Ft
Est. Value
About This Home
This home is located at 1313 63rd St SE Unit 1313A, Everett, WA 98203 and is currently estimated at $544,600, approximately $363 per square foot. 1313 63rd St SE Unit 1313A is a home located in Snohomish County with nearby schools including Lowell Elementary School, Evergreen Middle School, and Everett High School.
Ownership History
Date
Name
Owned For
Owner Type
Purchase Details
Closed on
Jul 11, 2018
Sold by
Chadesh Veronica M
Bought by
Song Rosemary and Song Edwin
Current Estimated Value
Home Financials for this Owner
Home Financials are based on the most recent Mortgage that was taken out on this home.
Original Mortgage
$306,000
Outstanding Balance
$265,781
Interest Rate
4.6%
Mortgage Type
New Conventional
Estimated Equity
$278,819
Purchase Details
Closed on
Dec 7, 2015
Sold by
Petersen Colleen O and Petersen Charles K
Bought by
Chadesh Veronica M
Purchase Details
Closed on
Aug 17, 1999
Sold by
Baldwin Richard F and Baldwin Katherine
Bought by
Petersen Charles K and Petersen Colleen O
Home Financials for this Owner
Home Financials are based on the most recent Mortgage that was taken out on this home.
Original Mortgage
$141,100
Interest Rate
7.5%
Create a Home Valuation Report for This Property
The Home Valuation Report is an in-depth analysis detailing your home's value as well as a comparison with similar homes in the area
Home Values in the Area
Average Home Value in this Area
Purchase History
| Date | Buyer | Sale Price | Title Company |
|---|---|---|---|
| Song Rosemary | $340,000 | First American Title Insuran | |
| Chadesh Veronica M | $247,500 | Cw Title | |
| Petersen Charles K | $145,475 | -- |
Source: Public Records
Mortgage History
| Date | Status | Borrower | Loan Amount |
|---|---|---|---|
| Open | Song Rosemary | $306,000 | |
| Previous Owner | Petersen Charles K | $141,100 |
Source: Public Records
Tax History
| Year | Tax Paid | Tax Assessment Tax Assessment Total Assessment is a certain percentage of the fair market value that is determined by local assessors to be the total taxable value of land and additions on the property. | Land | Improvement |
|---|---|---|---|---|
| 2025 | $4,553 | $502,500 | $106,500 | $396,000 |
| 2024 | $4,553 | $529,000 | $100,500 | $428,500 |
| 2023 | $3,352 | $407,000 | $95,500 | $311,500 |
| 2022 | $3,167 | $345,000 | $81,000 | $264,000 |
| 2020 | $3,740 | $332,500 | $113,000 | $219,500 |
| 2019 | $3,325 | $297,500 | $113,000 | $184,500 |
| 2018 | $2,975 | $244,000 | $50,000 | $194,000 |
| 2017 | $2,876 | $235,000 | $50,000 | $185,000 |
| 2016 | $2,272 | $195,000 | $50,000 | $145,000 |
| 2015 | $2,245 | $181,500 | $44,500 | $137,000 |
| 2013 | $1,305 | $93,000 | $44,500 | $48,500 |
Source: Public Records
Map
Nearby Homes
- 6325 Evergreen Way
- 6714 Berkshire Dr
- 6302 Fleming St
- 6018 Fleming St
- 5809 Highway Place Unit B304
- 5809 Highway Place Unit B301
- 1225 Madison St
- 6303 Cady Rd
- 6627 Beverly Blvd Unit A
- 6518 Cady Rd
- 6705 Cady Rd
- 7027 Rainier Dr Unit E
- 7027 Rainier Dr Unit G
- 7027 Rainier Dr Unit H
- 7027 Rainier Dr Unit A
- 7203 Olympic Dr
- 2011 Madison St
- 5716 Wetmore Ave
- 6611 Commercial Ave Unit 3
- 5304 Fleming St Unit B
- 6307 Berkshire Dr Unit A
- 6307 Berkshire Dr
- 1309 63rd St SE
- 6307 Berkshire Dr Unit 3B
- 1309 63rd St SE
- 1309 63rd St SE Unit B
- 6307 Berkshire Dr Unit B
- 1313 63rd St SE
- 1313 63rd St SE
- 1313 63rd St SE Unit B
- 1313 63rd St SE Unit A
- 6229 Berkshire Dr Unit A & B
- 6229 Berkshire Dr
- 1307 63rd St SE
- 1311 63rd St SE
- 1301 63rd St SE
- 1321 63rd St SE
- 1311R 63rd St SE
- 1227 63rd St SE
- 1317 63rd St SE
Your Personal Tour Guide
Ask me questions while you tour the home.