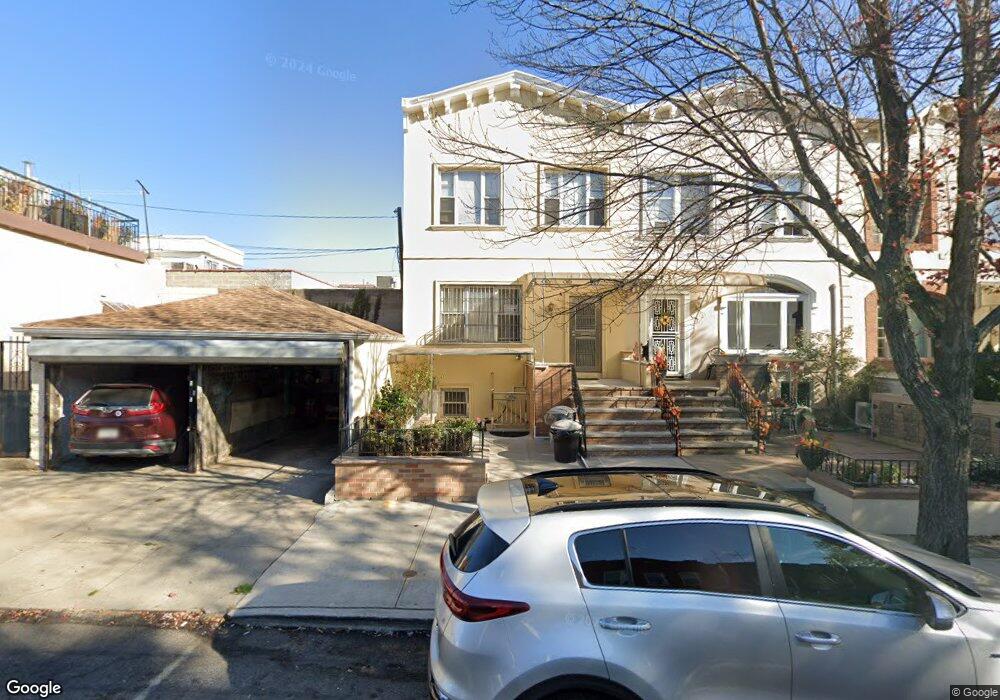
1313 77th St Brooklyn, NY 11228
Dyker Heights NeighborhoodEstimated Value: $1,142,604 - $1,337,000
--
Bed
--
Bath
1,700
Sq Ft
$724/Sq Ft
Est. Value
About This Home
This home is located at 1313 77th St, Brooklyn, NY 11228 and is currently estimated at $1,231,401, approximately $724 per square foot. 1313 77th St is a home located in Kings County with nearby schools including P.S. 204 Vince Lombardi, IS 201 Madeleine Brennan Intermediate School, and New Utrecht High School.
Ownership History
Date
Name
Owned For
Owner Type
Purchase Details
Closed on
Jul 28, 2016
Sold by
Hui Helen Lap Mei
Bought by
Helen Lap Mei Hui As Trustee and The Helen Lap Mei Hui Revocable Trust
Current Estimated Value
Purchase Details
Closed on
Jun 22, 1998
Sold by
Gamuzza Zina
Bought by
Hui Helen Lap Mei
Home Financials for this Owner
Home Financials are based on the most recent Mortgage that was taken out on this home.
Original Mortgage
$20,000
Interest Rate
6.9%
Create a Home Valuation Report for This Property
The Home Valuation Report is an in-depth analysis detailing your home's value as well as a comparison with similar homes in the area
Home Values in the Area
Average Home Value in this Area
Purchase History
| Date | Buyer | Sale Price | Title Company |
|---|---|---|---|
| Helen Lap Mei Hui As Trustee | $23,822 | -- | |
| Hui Helen Lap Mei | $223,000 | -- |
Source: Public Records
Mortgage History
| Date | Status | Borrower | Loan Amount |
|---|---|---|---|
| Previous Owner | Hui Helen Lap Mei | $20,000 | |
| Closed | Hui Helen Lap Mei | $150,000 |
Source: Public Records
Tax History Compared to Growth
Tax History
| Year | Tax Paid | Tax Assessment Tax Assessment Total Assessment is a certain percentage of the fair market value that is determined by local assessors to be the total taxable value of land and additions on the property. | Land | Improvement |
|---|---|---|---|---|
| 2025 | $2,835 | $75,300 | $17,760 | $57,540 |
| 2024 | $2,835 | $67,320 | $17,760 | $49,560 |
| 2023 | $2,921 | $67,800 | $17,760 | $50,040 |
| 2022 | $2,517 | $64,920 | $17,760 | $47,160 |
| 2021 | $2,689 | $63,480 | $17,760 | $45,720 |
| 2020 | $2,016 | $47,700 | $17,760 | $29,940 |
| 2019 | $4,026 | $47,700 | $17,760 | $29,940 |
| 2018 | $3,832 | $29,378 | $9,049 | $20,329 |
| 2017 | $5,397 | $27,945 | $8,952 | $18,993 |
| 2016 | $4,990 | $26,512 | $9,104 | $17,408 |
| 2015 | $2,960 | $26,374 | $12,667 | $13,707 |
| 2014 | $2,960 | $24,883 | $14,337 | $10,546 |
Source: Public Records
Map
Nearby Homes