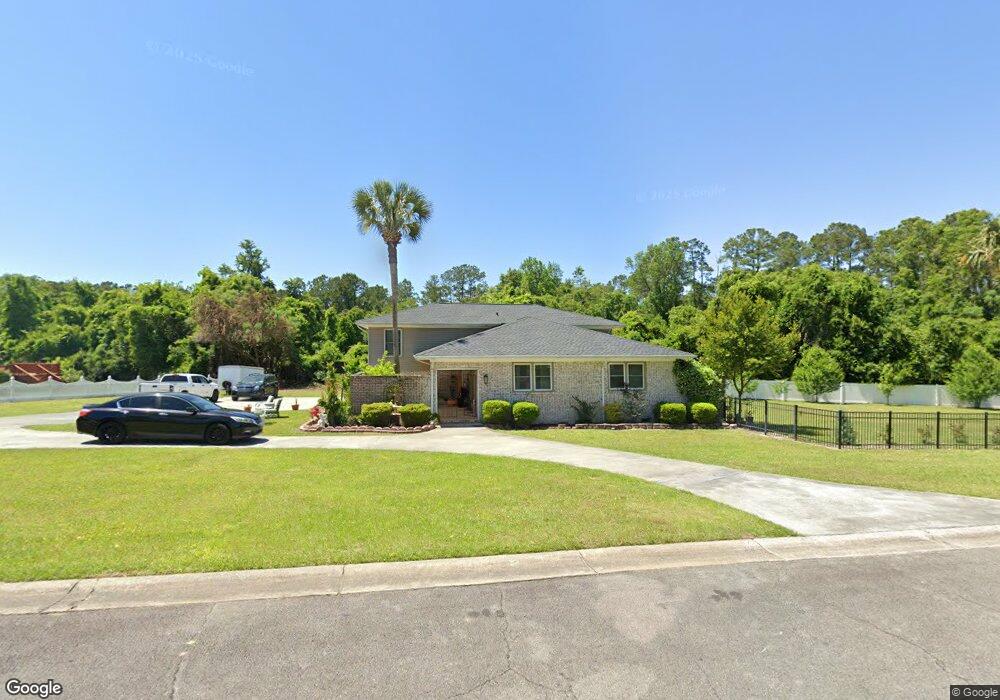
1313 Baltimore Cir Waycross, GA 31501
Estimated Value: $292,000 - $348,000
4
Beds
3
Baths
2,556
Sq Ft
$126/Sq Ft
Est. Value
About This Home
This home is located at 1313 Baltimore Cir, Waycross, GA 31501 and is currently estimated at $323,221, approximately $126 per square foot. 1313 Baltimore Cir is a home located in Ware County with nearby schools including Williams Heights Elementary School, Waycross Middle School, and Ware County High School.
Ownership History
Date
Name
Owned For
Owner Type
Purchase Details
Closed on
Feb 17, 2021
Sold by
Momin Shohel
Bought by
Dhar Ashit Kumar and Dhar Rewaben K
Current Estimated Value
Home Financials for this Owner
Home Financials are based on the most recent Mortgage that was taken out on this home.
Original Mortgage
$47,226
Outstanding Balance
$16,105
Interest Rate
2.7%
Mortgage Type
Commercial
Estimated Equity
$307,116
Purchase Details
Closed on
Dec 19, 2014
Sold by
Scott Olynthia Irrevoc
Bought by
Momin Shohel
Home Financials for this Owner
Home Financials are based on the most recent Mortgage that was taken out on this home.
Original Mortgage
$52,500
Interest Rate
4.04%
Purchase Details
Closed on
Feb 8, 2013
Sold by
Scott Olynthia Yvonne
Bought by
Scott Gerald F and Scott Olynthia Irrevoc
Purchase Details
Closed on
May 23, 2007
Sold by
Scott Gerrald F
Bought by
Scott Olynthia Y
Purchase Details
Closed on
Apr 8, 2002
Sold by
Swinson Joan
Bought by
Scott Eddie J and Scott Olynthia Y
Purchase Details
Closed on
Jan 3, 1986
Create a Home Valuation Report for This Property
The Home Valuation Report is an in-depth analysis detailing your home's value as well as a comparison with similar homes in the area
Home Values in the Area
Average Home Value in this Area
Purchase History
| Date | Buyer | Sale Price | Title Company |
|---|---|---|---|
| Dhar Ashit Kumar | $45,126 | -- | |
| Momin Shohel | $102,500 | -- | |
| Scott Gerald F | -- | -- | |
| Scott Olynthia Y | -- | -- | |
| Scott Eddie J | $105,000 | -- | |
| -- | -- | -- |
Source: Public Records
Mortgage History
| Date | Status | Borrower | Loan Amount |
|---|---|---|---|
| Open | Dhar Ashit Kumar | $47,226 | |
| Previous Owner | Momin Shohel | $52,500 |
Source: Public Records
Tax History Compared to Growth
Tax History
| Year | Tax Paid | Tax Assessment Tax Assessment Total Assessment is a certain percentage of the fair market value that is determined by local assessors to be the total taxable value of land and additions on the property. | Land | Improvement |
|---|---|---|---|---|
| 2024 | $4,465 | $131,180 | $14,560 | $116,620 |
| 2023 | $4,524 | $85,967 | $7,000 | $78,967 |
| 2022 | $3,426 | $85,967 | $7,000 | $78,967 |
| 2021 | $2,954 | $68,317 | $7,000 | $61,317 |
| 2020 | $2,926 | $67,142 | $7,000 | $60,142 |
| 2019 | $2,760 | $62,440 | $7,000 | $55,440 |
| 2018 | $2,699 | $60,481 | $7,000 | $53,481 |
| 2017 | $2,637 | $60,481 | $7,000 | $53,481 |
| 2016 | $2,637 | $60,481 | $7,000 | $53,481 |
| 2015 | $1,800 | $60,481 | $7,000 | $53,481 |
| 2014 | $2,653 | $60,481 | $7,000 | $53,481 |
| 2013 | -- | $60,481 | $7,000 | $53,481 |
Source: Public Records
Map
Nearby Homes
- 1502 Seminole Trail
- 1400 E Cherokee Dr
- 00 Seminole Trail
- 1621 Camellia Dr
- 1204 Richmond Ave
- 1100 Euclid Ave
- 1312 Atlantic Ave
- 1605 Booth St
- 1009 Euclid Ave
- 1703 Rainbow Dr
- Lot 3 City Blvd
- 1205 Dean Dr
- 1001 Baltimore Ave
- 807 City Blvd
- 914 Barkley St
- 1001 Coral Rd
- 1715 City Blvd
- 1103 Kontz Ave
- 907 Euclid Ave
- 1100 Atlantic Ave
- 1311 Baltimore Cir
- 1314 Baltimore Cir
- 216 Plantation Dr
- 1312 Baltimore Cir
- 211 Plantation Dr
- 1309 Baltimore Cir
- 1310 Baltimore Cir
- 212 Plantation Dr
- 207 Plantation Dr
- 1307 Baltimore Cir
- 1310 Coral Rd
- 1308 Coral Rd
- Lot 40 Plantation Bluffs Dr
- 1308 Baltimore Cir
- 1312 Coral Rd
- 1306 Coral Rd
- 210 Plantation Dr
- 1304 Coral Rd
- 1306 Baltimore Cir
- 1305 Baltimore Cir