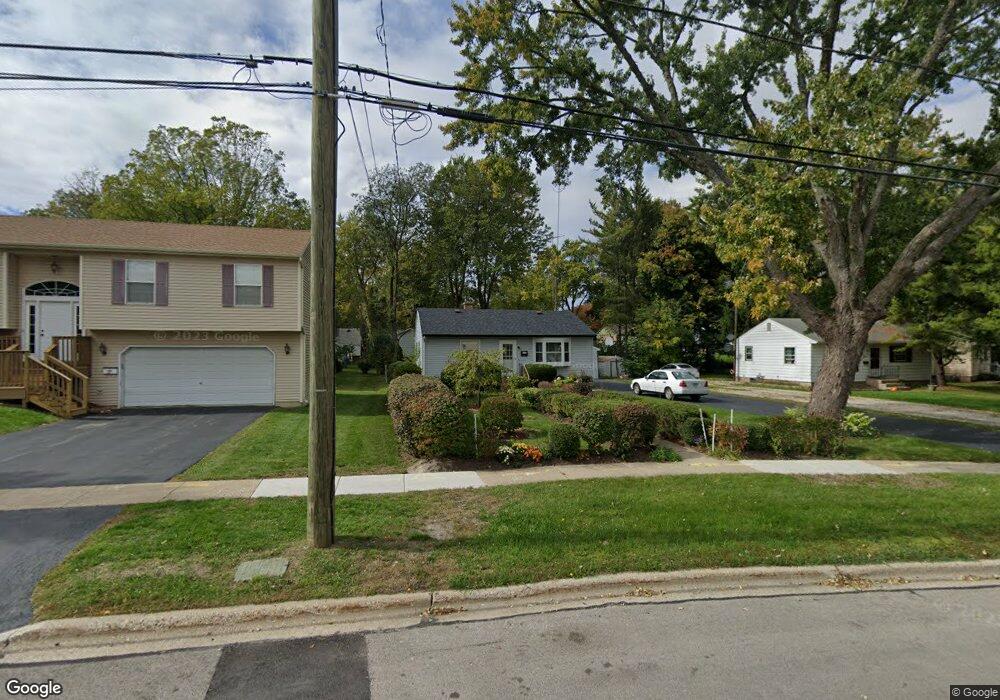
1313 Clay St Woodstock, IL 60098
Estimated Value: $188,000 - $220,000
2
Beds
1
Bath
768
Sq Ft
$273/Sq Ft
Est. Value
About This Home
This home is located at 1313 Clay St, Woodstock, IL 60098 and is currently estimated at $210,010, approximately $273 per square foot. 1313 Clay St is a home located in McHenry County with nearby schools including Westwood Elementary School, Northwood Middle School, and Woodstock North High School.
Ownership History
Date
Name
Owned For
Owner Type
Purchase Details
Closed on
May 28, 1999
Sold by
Tafolla Benjamin and Tafolla Maria L
Bought by
Tafolla Benjamin
Current Estimated Value
Home Financials for this Owner
Home Financials are based on the most recent Mortgage that was taken out on this home.
Original Mortgage
$106,400
Outstanding Balance
$28,293
Interest Rate
7.15%
Estimated Equity
$181,717
Purchase Details
Closed on
Jun 2, 1997
Sold by
Tafolla Benjamin H and Zamorano Jose M
Bought by
Tafolla Benjamin H and Tafolla Maria L
Home Financials for this Owner
Home Financials are based on the most recent Mortgage that was taken out on this home.
Original Mortgage
$84,000
Interest Rate
10.49%
Purchase Details
Closed on
Mar 30, 1995
Sold by
Crossman Lester W and Enid Crossman G
Bought by
Tafolla Benjamin H and Zamorano Jose M
Home Financials for this Owner
Home Financials are based on the most recent Mortgage that was taken out on this home.
Original Mortgage
$94,479
Interest Rate
8.64%
Mortgage Type
FHA
Create a Home Valuation Report for This Property
The Home Valuation Report is an in-depth analysis detailing your home's value as well as a comparison with similar homes in the area
Home Values in the Area
Average Home Value in this Area
Purchase History
| Date | Buyer | Sale Price | Title Company |
|---|---|---|---|
| Tafolla Benjamin | -- | -- | |
| Tafolla Benjamin H | -- | -- | |
| Tafolla Benjamin H | $95,000 | Attorneys Natl Title Network |
Source: Public Records
Mortgage History
| Date | Status | Borrower | Loan Amount |
|---|---|---|---|
| Open | Tafolla Benjamin | $106,400 | |
| Closed | Tafolla Benjamin H | $84,000 | |
| Closed | Tafolla Benjamin H | $94,479 | |
| Closed | Tafolla Benjamin H | $21,000 |
Source: Public Records
Tax History Compared to Growth
Tax History
| Year | Tax Paid | Tax Assessment Tax Assessment Total Assessment is a certain percentage of the fair market value that is determined by local assessors to be the total taxable value of land and additions on the property. | Land | Improvement |
|---|---|---|---|---|
| 2024 | $4,815 | $59,755 | $10,703 | $49,052 |
| 2023 | $4,610 | $54,646 | $9,788 | $44,858 |
| 2022 | $4,498 | $49,102 | $8,795 | $40,307 |
| 2021 | $4,243 | $45,685 | $8,183 | $37,502 |
| 2020 | $3,687 | $39,861 | $7,759 | $32,102 |
| 2019 | $3,516 | $37,530 | $7,305 | $30,225 |
| 2018 | $3,313 | $35,209 | $6,853 | $28,356 |
| 2017 | $3,221 | $33,045 | $6,432 | $26,613 |
| 2016 | $3,213 | $31,022 | $6,038 | $24,984 |
| 2013 | -- | $30,734 | $5,982 | $24,752 |
Source: Public Records
Map
Nearby Homes
- 1546 Wheeler St
- 1109 Tappan St
- 1026 Clay St
- 1626 Wheeler St
- 740 Victoria Dr
- 105 Terry Ct
- 841 N Madison St
- 1891 Wicker St Unit 3
- 724 Wheeler St
- 935 Marvel Ave
- 244 Joseph St
- 814 Robert Dr
- Block 153 Joseph St
- 150 1st St
- 631 Mchenry Ave
- 15 North St Unit 4H
- 0 N Seminary Ave Unit MRD11676693
- 709 Mchenry Ave
- 338 Mchenry Ave
- 0 Rt 47 & Lucas Rd Unit MRD12293021