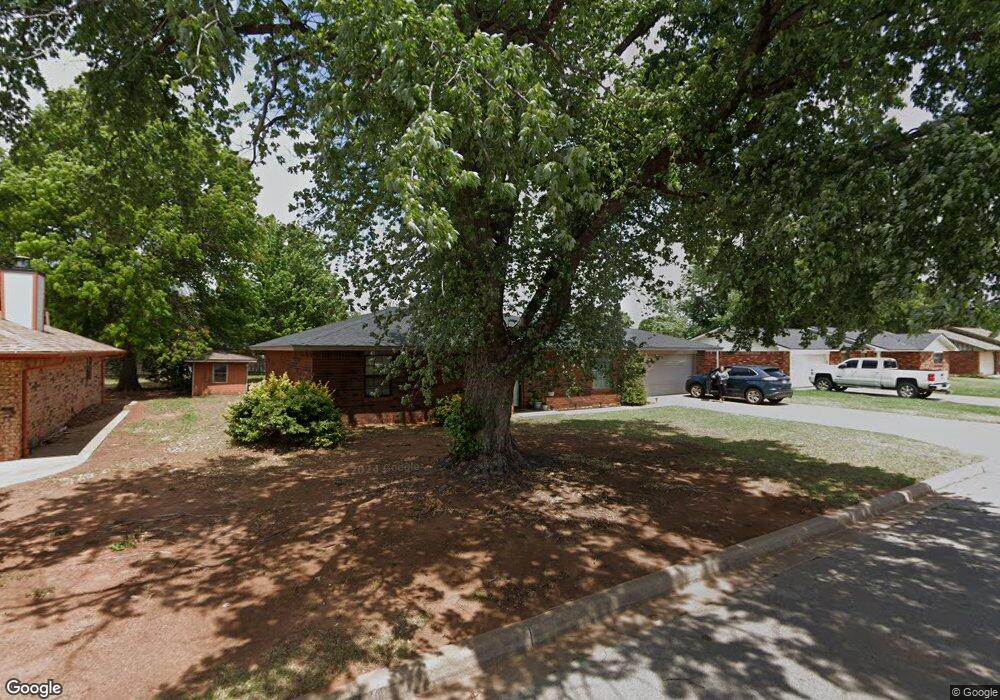
1313 E Quail Ave Weatherford, OK 73096
Estimated Value: $185,549 - $216,000
3
Beds
2
Baths
1,281
Sq Ft
$159/Sq Ft
Est. Value
About This Home
This home is located at 1313 E Quail Ave, Weatherford, OK 73096 and is currently estimated at $203,387, approximately $158 per square foot. 1313 E Quail Ave is a home located in Custer County with nearby schools including Burcham Elementary School, Lt. General Thomas P. Stafford Elementary School, and Weatherford West Elementary School.
Ownership History
Date
Name
Owned For
Owner Type
Purchase Details
Closed on
May 28, 2025
Sold by
Pat J J and Pat Sullivan J
Bought by
Perkins Abby
Current Estimated Value
Home Financials for this Owner
Home Financials are based on the most recent Mortgage that was taken out on this home.
Original Mortgage
$164,646
Outstanding Balance
$162,995
Interest Rate
0.68%
Mortgage Type
Construction
Estimated Equity
$40,392
Purchase Details
Closed on
Oct 22, 2007
Sold by
Jerri L Bradshaw Etvir
Bought by
Patrick E King
Purchase Details
Closed on
Dec 15, 2006
Sold by
Robert Whitefield
Bought by
Jerri L Bradshaw
Purchase Details
Closed on
Nov 4, 2002
Sold by
Scott Eldon Mathis
Bought by
Robert Whitefield
Purchase Details
Closed on
Jun 17, 1994
Sold by
Terry L Haub
Bought by
Scott Eldon Mathis
Create a Home Valuation Report for This Property
The Home Valuation Report is an in-depth analysis detailing your home's value as well as a comparison with similar homes in the area
Home Values in the Area
Average Home Value in this Area
Purchase History
| Date | Buyer | Sale Price | Title Company |
|---|---|---|---|
| Perkins Abby | $160,000 | Ort | |
| Patrick E King | $115,000 | -- | |
| Jerri L Bradshaw | $115,000 | -- | |
| Robert Whitefield | $86,000 | -- | |
| Scott Eldon Mathis | $69,000 | -- |
Source: Public Records
Mortgage History
| Date | Status | Borrower | Loan Amount |
|---|---|---|---|
| Open | Perkins Abby | $164,646 | |
| Closed | Perkins Abby | $5,762 |
Source: Public Records
Tax History Compared to Growth
Tax History
| Year | Tax Paid | Tax Assessment Tax Assessment Total Assessment is a certain percentage of the fair market value that is determined by local assessors to be the total taxable value of land and additions on the property. | Land | Improvement |
|---|---|---|---|---|
| 2025 | $1,571 | $16,727 | $2,435 | $14,292 |
| 2024 | $1,571 | $15,323 | $1,827 | $13,496 |
| 2023 | $1,571 | $16,154 | $1,827 | $14,327 |
| 2022 | $1,554 | $16,154 | $1,827 | $14,327 |
| 2021 | $1,566 | $16,154 | $1,827 | $14,327 |
| 2020 | $1,563 | $15,511 | $1,827 | $13,684 |
| 2019 | $1,504 | $14,772 | $1,827 | $12,945 |
| 2018 | $1,355 | $14,642 | $1,737 | $12,905 |
| 2017 | $1,220 | $13,945 | $1,663 | $12,282 |
| 2016 | $1,193 | $13,538 | $1,587 | $11,951 |
| 2015 | $1,172 | $13,143 | $1,662 | $11,481 |
| 2014 | $1,133 | $12,761 | $1,652 | $11,109 |
Source: Public Records
Map
Nearby Homes
- 1400 Rolling Hills St
- 0 Debra Dr
- 1804 Kristie Ln
- 1414 Chisholm Trail
- 1509 Steiner Rd
- 0 N Washington Ave
- 24130 E 1016 Rd
- 10009 Lark St
- 24126 E 1016 Rd
- 24122 E 1016 Rd
- 1312 Linwood St
- 708 Cornerstone Ave
- 1300 Crimson Dr
- 24117 E 106 Rd
- 1316 N Lark St
- 24131 E 1016 Rd
- 1535 Mockingbird Ln
- 24119 E 1016 Rd
- 1230 N Indiana St
- 24109 E 1016 Rd
- 1320 Steiner Rd
- 1316 Steiner Rd
- 1312 E Quail Ave
- 1321 E Quail Ave
- 1324 Steiner Rd
- 1316 E Quail Ave
- 1316 Quail Ave
- 1312 Steiner Rd
- 1320 E Quail Ave
- 1328 Steiner Rd
- 1325 Quail Ave
- 1800 Debra Dr
- 1308 Steiner Rd
- 1302 Quail Ave Unit 2
- 1313 Plains Ave
- 1324 E Quail Ave
- 1332 Steiner Rd
- 1317 Plains Ave
- 1325 Steiner Rd
- 1801 Debra Dr