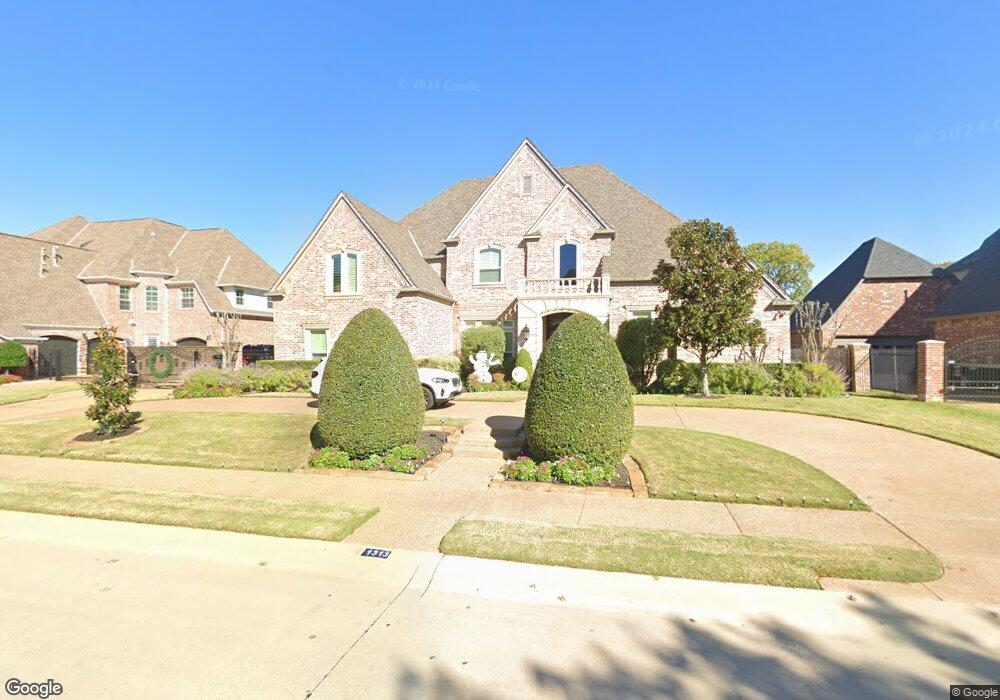
1313 Eagle Bend Southlake, TX 76092
Estimated Value: $2,039,000 - $2,363,000
5
Beds
5
Baths
5,969
Sq Ft
$365/Sq Ft
Est. Value
About This Home
This home is located at 1313 Eagle Bend, Southlake, TX 76092 and is currently estimated at $2,180,655, approximately $365 per square foot. 1313 Eagle Bend is a home located in Tarrant County with nearby schools including Robert High Rockenbaugh Elementary School, Eubanks Intermediate School, and George Dawson Middle School.
Ownership History
Date
Name
Owned For
Owner Type
Purchase Details
Closed on
Aug 3, 2017
Sold by
Giger Renato Carlo and Giger Iris
Bought by
Briggle Josh D and Briggle Rosemary H
Current Estimated Value
Home Financials for this Owner
Home Financials are based on the most recent Mortgage that was taken out on this home.
Original Mortgage
$818,350
Outstanding Balance
$681,741
Interest Rate
3.9%
Mortgage Type
New Conventional
Estimated Equity
$1,498,914
Purchase Details
Closed on
Sep 23, 2010
Sold by
Chellgren Paul Gregory and Chellgren Marianne Daly
Bought by
Giger Renato Carlo
Home Financials for this Owner
Home Financials are based on the most recent Mortgage that was taken out on this home.
Original Mortgage
$808,000
Interest Rate
4.12%
Mortgage Type
New Conventional
Purchase Details
Closed on
Nov 1, 1999
Sold by
Newton Kustom Kastles Inc
Bought by
Chellgren Paul Gregory and Chellgren Marianne Daly
Create a Home Valuation Report for This Property
The Home Valuation Report is an in-depth analysis detailing your home's value as well as a comparison with similar homes in the area
Home Values in the Area
Average Home Value in this Area
Purchase History
| Date | Buyer | Sale Price | Title Company |
|---|---|---|---|
| Briggle Josh D | -- | None Available | |
| Giger Renato Carlo | -- | Fatco | |
| Chellgren Paul Gregory | -- | American Title Co |
Source: Public Records
Mortgage History
| Date | Status | Borrower | Loan Amount |
|---|---|---|---|
| Open | Briggle Josh D | $818,350 | |
| Previous Owner | Giger Renato Carlo | $808,000 | |
| Closed | Chellgren Paul Gregory | $0 |
Source: Public Records
Tax History Compared to Growth
Tax History
| Year | Tax Paid | Tax Assessment Tax Assessment Total Assessment is a certain percentage of the fair market value that is determined by local assessors to be the total taxable value of land and additions on the property. | Land | Improvement |
|---|---|---|---|---|
| 2025 | $21,227 | $1,790,135 | $440,000 | $1,350,135 |
| 2024 | $21,227 | $1,845,000 | $440,000 | $1,405,000 |
| 2023 | $23,572 | $1,800,000 | $440,000 | $1,360,000 |
| 2022 | $25,365 | $1,655,000 | $275,000 | $1,380,000 |
| 2021 | $24,369 | $1,068,835 | $275,000 | $793,835 |
| 2020 | $25,324 | $1,101,730 | $275,000 | $826,730 |
| 2019 | $26,770 | $1,105,502 | $275,000 | $830,502 |
| 2018 | $28,078 | $1,218,770 | $437,500 | $781,270 |
| 2017 | $28,504 | $1,150,000 | $481,250 | $668,750 |
| 2016 | $24,699 | $996,473 | $481,250 | $515,223 |
| 2015 | $24,526 | $979,700 | $175,000 | $804,700 |
| 2014 | $24,526 | $979,700 | $175,000 | $804,700 |
Source: Public Records
Map
Nearby Homes
- 1227 Strathmore Dr
- 608 Regency Crossing
- 7312 Hix Ct
- 1420 Kensington Ct
- 710 Longford Dr
- 7255 Oak Alley Dr
- 521 Regency Crossing
- 708 Nettleton Dr
- 802 Princeton Ct
- 7322 Calloway Ct
- 7316 Calloway Ct
- 1417 Nottoway Ct
- 1418 Nottoway Ct
- 1406 Nottoway Ct
- 7200 Belle Meade Dr
- TBD - Lot 3 John Mccain Rd
- TBD - Lot 1 John Mccain Rd
- 7012 Shepherds Glen
- 7106 Belle Meade Dr
- 712 Ashleigh Ln
- 1315 Eagle Bend Dr
- 1315 Eagle Bend
- 1311 Eagle Bend
- 1317 Eagle Bend
- 1309 Eagle Bend
- 402 Atherton Cir
- 413 Bryn Meadows
- 1319 Eagle Bend
- 1319 Eagle Bend Dr
- 1307 Eagle Bend
- 411 Bryn Meadows
- 400 Atherton Cir
- 403 Atherton Cir
- 407 Bryn Meadows
- 414 Bryn Meadows
- 1321 Eagle Bend
- 1305 Eagle Bend
- 401 Atherton Cir
- 412 Bryn Meadows
- 405 Bryn Meadows