Estimated Value: $294,318 - $556,000
3
Beds
2
Baths
1,832
Sq Ft
$206/Sq Ft
Est. Value
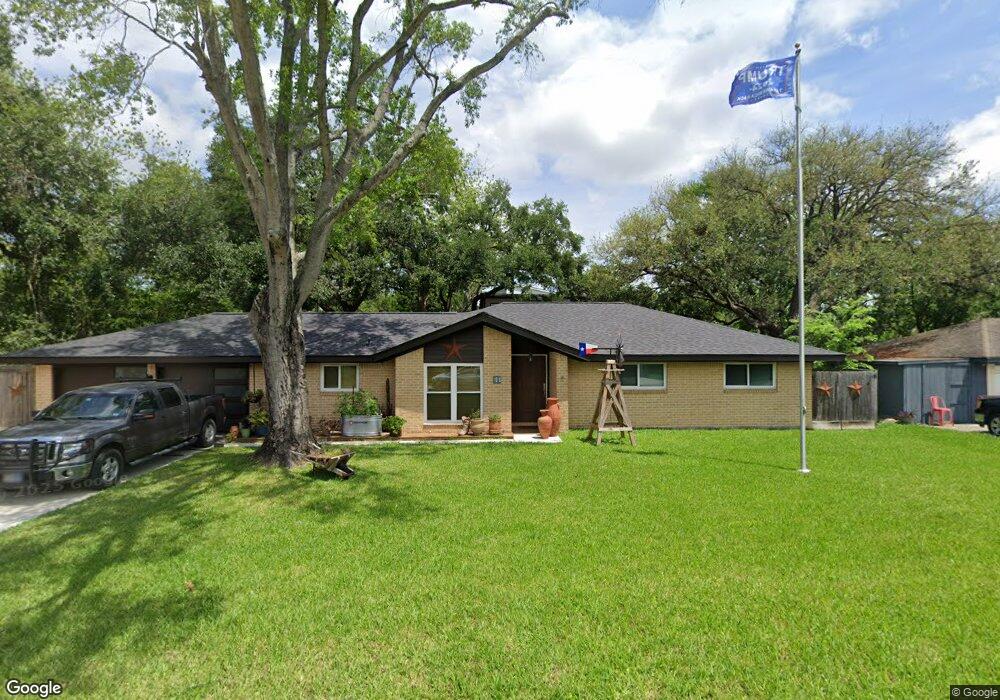
About This Home
This home is located at 1313 Fay Rd, Kemah, TX 77565 and is currently estimated at $377,080, approximately $205 per square foot. 1313 Fay Rd is a home located in Galveston County with nearby schools including Lavace Stewart Elementary School, Bayside Intermediate School, and Clear Falls High School.
Ownership History
Date
Name
Owned For
Owner Type
Purchase Details
Closed on
Jul 3, 2014
Sold by
Triple Z Texas Investments Llc
Bought by
Turon Terry A
Current Estimated Value
Home Financials for this Owner
Home Financials are based on the most recent Mortgage that was taken out on this home.
Original Mortgage
$135,000
Outstanding Balance
$102,945
Interest Rate
4.19%
Mortgage Type
New Conventional
Estimated Equity
$274,135
Purchase Details
Closed on
Mar 29, 2012
Sold by
Mtk Investments Llc
Bought by
Patriot Bank
Create a Home Valuation Report for This Property
The Home Valuation Report is an in-depth analysis detailing your home's value as well as a comparison with similar homes in the area
Home Values in the Area
Average Home Value in this Area
Purchase History
| Date | Buyer | Sale Price | Title Company |
|---|---|---|---|
| Turon Terry A | -- | None Available | |
| Patriot Bank | -- | None Available |
Source: Public Records
Mortgage History
| Date | Status | Borrower | Loan Amount |
|---|---|---|---|
| Open | Turon Terry A | $135,000 |
Source: Public Records
Tax History Compared to Growth
Tax History
| Year | Tax Paid | Tax Assessment Tax Assessment Total Assessment is a certain percentage of the fair market value that is determined by local assessors to be the total taxable value of land and additions on the property. | Land | Improvement |
|---|---|---|---|---|
| 2025 | $2,775 | $276,025 | -- | -- |
| 2024 | $2,775 | $250,932 | -- | -- |
| 2023 | $2,775 | $228,120 | $107,920 | $120,200 |
| 2022 | $4,146 | $220,000 | $0 | $0 |
| 2021 | $5,042 | $232,280 | $33,640 | $198,640 |
| 2020 | $3,464 | $151,350 | $33,640 | $117,710 |
| 2019 | $3,624 | $151,350 | $33,190 | $118,160 |
| 2018 | $3,674 | $152,790 | $33,190 | $119,600 |
| 2017 | $3,750 | $154,230 | $33,190 | $121,040 |
| 2016 | $3,750 | $154,240 | $33,190 | $121,050 |
| 2015 | $1,698 | $154,240 | $33,190 | $121,050 |
| 2014 | $1,203 | $108,740 | $33,190 | $75,550 |
Source: Public Records
Map
Nearby Homes