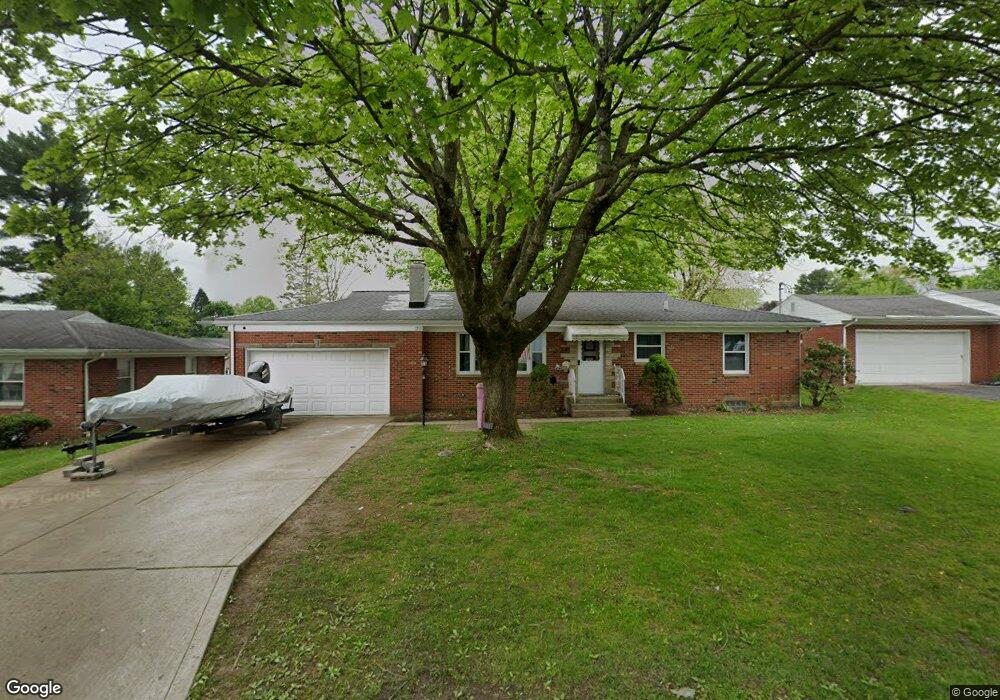
1313 N Mulberry St Mount Vernon, OH 43050
Estimated Value: $210,000 - $214,129
3
Beds
1
Bath
1,134
Sq Ft
$187/Sq Ft
Est. Value
About This Home
This home is located at 1313 N Mulberry St, Mount Vernon, OH 43050 and is currently estimated at $212,032, approximately $186 per square foot. 1313 N Mulberry St is a home located in Knox County with nearby schools including Mount Vernon High School, St. Vincent de Paul School, and Christian Star Academy.
Ownership History
Date
Name
Owned For
Owner Type
Purchase Details
Closed on
May 11, 2021
Sold by
14 North Llc
Bought by
Wilson Jessica A
Current Estimated Value
Home Financials for this Owner
Home Financials are based on the most recent Mortgage that was taken out on this home.
Original Mortgage
$147,283
Outstanding Balance
$133,475
Interest Rate
3.1%
Mortgage Type
FHA
Estimated Equity
$78,557
Purchase Details
Closed on
Feb 15, 2014
Sold by
Muka Nardi Y and Muka Minka
Bought by
14 North Llc
Purchase Details
Closed on
Nov 20, 2013
Sold by
Kline Wilbur Earl and Kline Lesley
Bought by
Muka Nardi Y and Muka Minka
Purchase Details
Closed on
Sep 21, 2006
Sold by
Hedges Marlene E
Bought by
Kline Virginia Mae
Create a Home Valuation Report for This Property
The Home Valuation Report is an in-depth analysis detailing your home's value as well as a comparison with similar homes in the area
Home Values in the Area
Average Home Value in this Area
Purchase History
| Date | Buyer | Sale Price | Title Company |
|---|---|---|---|
| Wilson Jessica A | $152,666 | None Available | |
| 14 North Llc | -- | None Available | |
| Muka Nardi Y | $63,750 | None Available | |
| Kline Virginia Mae | $78,750 | None Available |
Source: Public Records
Mortgage History
| Date | Status | Borrower | Loan Amount |
|---|---|---|---|
| Open | Wilson Jessica A | $147,283 |
Source: Public Records
Tax History Compared to Growth
Tax History
| Year | Tax Paid | Tax Assessment Tax Assessment Total Assessment is a certain percentage of the fair market value that is determined by local assessors to be the total taxable value of land and additions on the property. | Land | Improvement |
|---|---|---|---|---|
| 2024 | $1,953 | $49,370 | $8,370 | $41,000 |
| 2023 | $1,953 | $49,370 | $8,370 | $41,000 |
| 2022 | $1,544 | $35,510 | $6,020 | $29,490 |
| 2021 | $1,544 | $35,510 | $6,020 | $29,490 |
| 2020 | $1,504 | $35,510 | $6,020 | $29,490 |
| 2019 | $1,538 | $33,850 | $6,500 | $27,350 |
| 2018 | $1,540 | $33,850 | $6,500 | $27,350 |
| 2017 | $1,515 | $33,850 | $6,500 | $27,350 |
| 2016 | $1,406 | $31,340 | $6,020 | $25,320 |
| 2015 | $1,412 | $31,340 | $6,020 | $25,320 |
| 2014 | $1,419 | $31,340 | $6,020 | $25,320 |
| 2013 | $1,491 | $31,330 | $5,660 | $25,670 |
Source: Public Records
Map
Nearby Homes
- 9 Rose Ave
- 6 Miller Ave
- 107 Northridge Dr
- 109 Northridge Dr
- 12 Northview Dr
- 200 Mansfield Rd
- 769 Upper Fredericktown Rd
- 800 N Sandusky St
- 10 Yoakam Dr
- 812 N Gay St
- 300 1/2 Calhoun St
- 33 Longitude Dr
- 13 Mansfield Ave
- 7 Elizabeth St
- 604 N Gay St
- 0 W Pleasant St
- 12567 Upper Fredericktown Rd
- 404 N Gay St
- 1311 N Mulberry St
- 110 Rose Ave
- 114 Rose Ave
- 1317 N Mulberry St
- 1309 N Mulberry St
- 108 Rose Ave
- 4 Swingle Ave
- 116 Rose Ave
- 1400 N Mulberry St
- 1319 N Mulberry St
- 1307 N Mulberry St
- 1308 N Mulberry St
- 118 Rose Ave
- 106 Rose Ave
- 3 Swingle Ave
- 1402 N Mulberry St
- 1305 N Mulberry St
- 111 Rose Ave
- 115 Rose Ave