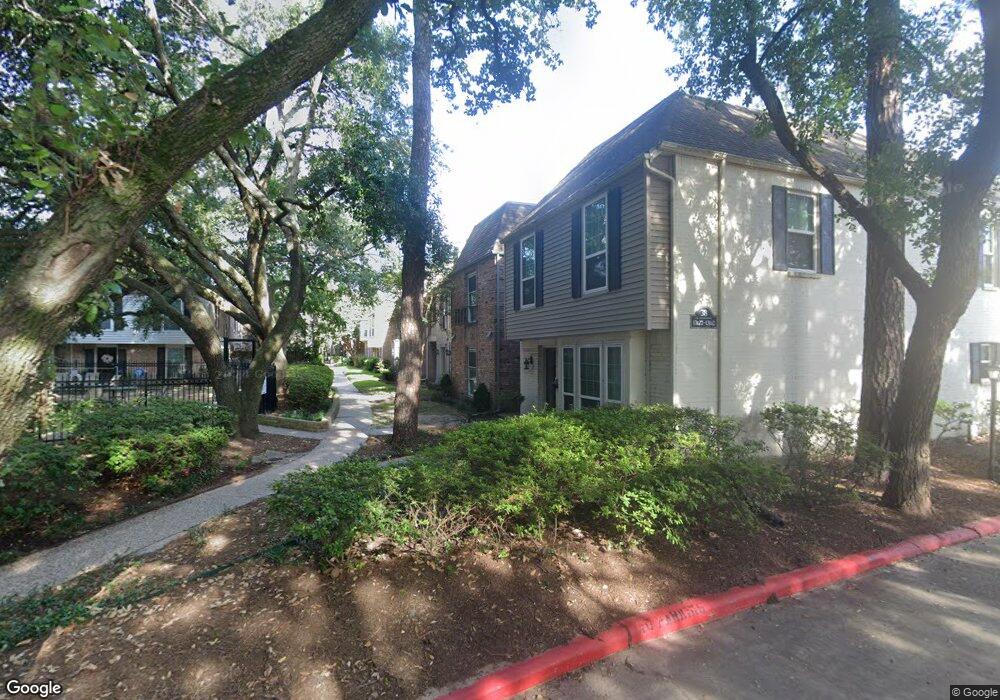
13132 Trail Hollow Dr Unit 3132 Houston, TX 77079
Memorial NeighborhoodEstimated Value: $246,973 - $280,000
3
Beds
3
Baths
2,058
Sq Ft
$129/Sq Ft
Est. Value
About This Home
This home is located at 13132 Trail Hollow Dr Unit 3132, Houston, TX 77079 and is currently estimated at $266,493, approximately $129 per square foot. 13132 Trail Hollow Dr Unit 3132 is a home located in Harris County with nearby schools including Rummel Creek Elementary School, Memorial Middle, and Stratford High School.
Ownership History
Date
Name
Owned For
Owner Type
Purchase Details
Closed on
Dec 28, 2012
Sold by
Cho Inkyu and Cho Hye W
Bought by
Kim Sook Y
Current Estimated Value
Purchase Details
Closed on
Oct 12, 2005
Sold by
Bouwhuis Russell K and Bouwhuis Hyeshin
Bought by
Cho Inkyu and Cho Hye Won
Home Financials for this Owner
Home Financials are based on the most recent Mortgage that was taken out on this home.
Original Mortgage
$108,000
Interest Rate
5.65%
Mortgage Type
Fannie Mae Freddie Mac
Purchase Details
Closed on
Dec 28, 2001
Sold by
Beutnagel James Roy
Bought by
Bouwhuis Russell K and Bouwhuis Hyeshin
Home Financials for this Owner
Home Financials are based on the most recent Mortgage that was taken out on this home.
Original Mortgage
$87,100
Interest Rate
7.25%
Purchase Details
Closed on
Jun 26, 1996
Sold by
Rosenberg Norman E and Rosenberg Sylvia
Bought by
Source One
Create a Home Valuation Report for This Property
The Home Valuation Report is an in-depth analysis detailing your home's value as well as a comparison with similar homes in the area
Home Values in the Area
Average Home Value in this Area
Purchase History
| Date | Buyer | Sale Price | Title Company |
|---|---|---|---|
| Kim Sook Y | -- | None Available | |
| Cho Inkyu | -- | North American Title Co | |
| Bouwhuis Russell K | -- | Startex Title Company | |
| Source One | -- | -- |
Source: Public Records
Mortgage History
| Date | Status | Borrower | Loan Amount |
|---|---|---|---|
| Previous Owner | Cho Inkyu | $108,000 | |
| Previous Owner | Bouwhuis Russell K | $87,100 |
Source: Public Records
Tax History Compared to Growth
Tax History
| Year | Tax Paid | Tax Assessment Tax Assessment Total Assessment is a certain percentage of the fair market value that is determined by local assessors to be the total taxable value of land and additions on the property. | Land | Improvement |
|---|---|---|---|---|
| 2025 | $5,542 | $253,663 | $48,196 | $205,467 |
| 2024 | $5,542 | $251,427 | $47,771 | $203,656 |
| 2023 | $5,542 | $247,052 | $46,940 | $200,112 |
| 2022 | $5,963 | $255,069 | $48,463 | $206,606 |
| 2021 | $5,663 | $231,935 | $44,068 | $187,867 |
| 2020 | $5,766 | $230,139 | $43,726 | $186,413 |
| 2019 | $5,986 | $228,659 | $43,445 | $185,214 |
| 2018 | $3,161 | $258,368 | $49,090 | $209,278 |
| 2017 | $6,759 | $258,368 | $49,090 | $209,278 |
| 2016 | $6,608 | $252,590 | $47,992 | $204,598 |
| 2015 | $5,009 | $242,572 | $46,089 | $196,483 |
| 2014 | $5,009 | $188,209 | $35,760 | $152,449 |
Source: Public Records
Map
Nearby Homes
- 13194 Trail Hollow Dr Unit 3194
- 13074 Trail Hollow Dr Unit 3074
- 13228 Trail Hollow Dr Unit 3228
- 13060 Trail Hollow Dr Unit 3060
- 13050 Trail Hollow Dr
- 13316 Trail Hollow Dr Unit 3316
- 12971 Trail Hollow Dr Unit A
- 12973 Trail Hollow Dr Unit A
- 13282 Trail Hollow Dr Unit 3282
- 12978 Trail Hollow Dr Unit 2978
- 13346 Trail Hollow Dr Unit 3346
- 12984 Trail Hollow Dr Unit 2984
- 832 Wax Myrtle Ln Unit 832
- 893 Wax Myrtle Ln Unit 3
- 903 Wax Myrtle Ln
- 939 Wax Myrtle Ln
- 921 Wax Myrtle Ln
- 923 Wax Myrtle Ln
- 839 Wax Myrtle Ln
- 861 Wax Myrtle Ln
- 13134 Trail Hollow Dr Unit 3134
- 13132 Trail Hollow Dr Unit 13132
- 13132 Trail Hollow Dr Unit 6
- 13130 Trail Hollow Dr Unit 3130
- 13130 Trail Hollow Dr Unit 7
- 13138 Trail Hollow Dr Unit 3138
- 13128 Trail Hollow Dr Unit 3128
- 13140 Trail Hollow Dr Unit 3140
- 13126 Trail Hollow Dr Unit 3126
- 13126 Trail Hollow Dr Unit 13126
- 13126 Trail Hollow Dr Unit 9
- 13142 Trail Hollow Dr Unit 3142
- 13176 Trail Hollow Dr Unit 3176
- 13174 Trail Hollow Dr Unit 3174
- 13174 Trail Hollow Dr
- 13174 Trail Hollow Dr Unit 4
- 13172 Trail Hollow Dr Unit 3172
- 13124 Trail Hollow Dr Unit 3124
- 13178 Trail Hollow Dr Unit 3178
- 13178 Trail Hollow Dr