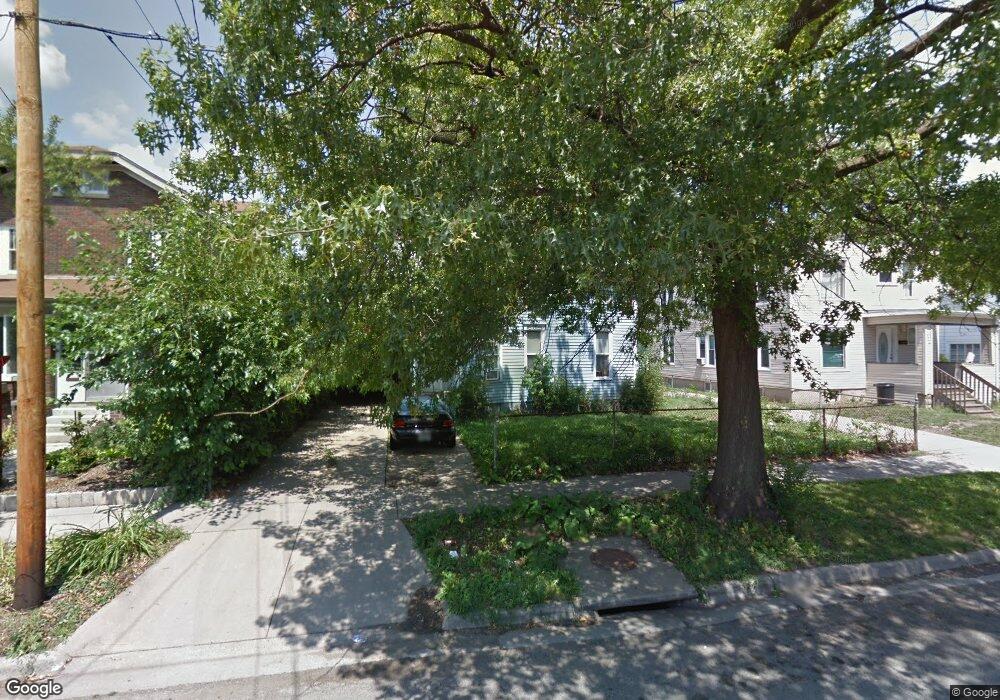
1314 5th Ave Rockford, IL 61104
Midtown District NeighborhoodEstimated Value: $109,000 - $139,000
3
Beds
3
Baths
1,724
Sq Ft
$70/Sq Ft
Est. Value
About This Home
This home is located at 1314 5th Ave, Rockford, IL 61104 and is currently estimated at $121,155, approximately $70 per square foot. 1314 5th Ave is a home located in Winnebago County with nearby schools including Constance Lane Elementary School, Abraham Lincoln Middle School, and Rockford East High School.
Ownership History
Date
Name
Owned For
Owner Type
Purchase Details
Closed on
Jun 14, 2024
Sold by
Roby David and Roby Judy
Bought by
Mondesi Hector and Ortiz Stephanie
Current Estimated Value
Home Financials for this Owner
Home Financials are based on the most recent Mortgage that was taken out on this home.
Original Mortgage
$92,886
Outstanding Balance
$91,091
Interest Rate
6.99%
Mortgage Type
FHA
Estimated Equity
$30,064
Purchase Details
Closed on
Sep 11, 2013
Bought by
Roby David B and Roby Judy L
Create a Home Valuation Report for This Property
The Home Valuation Report is an in-depth analysis detailing your home's value as well as a comparison with similar homes in the area
Home Values in the Area
Average Home Value in this Area
Purchase History
| Date | Buyer | Sale Price | Title Company |
|---|---|---|---|
| Mondesi Hector | $95,000 | None Listed On Document | |
| Roby David B | $7,000 | -- |
Source: Public Records
Mortgage History
| Date | Status | Borrower | Loan Amount |
|---|---|---|---|
| Open | Mondesi Hector | $92,886 |
Source: Public Records
Tax History Compared to Growth
Tax History
| Year | Tax Paid | Tax Assessment Tax Assessment Total Assessment is a certain percentage of the fair market value that is determined by local assessors to be the total taxable value of land and additions on the property. | Land | Improvement |
|---|---|---|---|---|
| 2024 | $1,511 | $21,944 | $2,610 | $19,334 |
| 2023 | $1,386 | $19,349 | $2,301 | $17,048 |
| 2022 | $1,291 | $17,295 | $2,057 | $15,238 |
| 2021 | $1,208 | $15,858 | $1,886 | $13,972 |
| 2020 | $1,156 | $14,992 | $1,783 | $13,209 |
| 2019 | $1,020 | $13,611 | $1,699 | $11,912 |
| 2018 | $1,545 | $13,468 | $1,602 | $11,866 |
| 2017 | $926 | $12,889 | $1,533 | $11,356 |
| 2016 | $1,141 | $14,187 | $1,504 | $12,683 |
| 2015 | $2,121 | $13,869 | $1,504 | $12,365 |
| 2014 | $1,437 | $15,311 | $1,876 | $13,435 |
Source: Public Records
Map
Nearby Homes