1314 Ausling Way Hillsborough, NC 27278
Estimated Value: $558,000 - $631,000
3
Beds
3
Baths
2,486
Sq Ft
$239/Sq Ft
Est. Value
About This Home
This home is located at 1314 Ausling Way, Hillsborough, NC 27278 and is currently estimated at $594,089, approximately $238 per square foot. 1314 Ausling Way is a home located in Orange County with nearby schools including Central Elementary School and Gravelly Hill Middle.
Ownership History
Date
Name
Owned For
Owner Type
Purchase Details
Closed on
Jan 3, 2018
Sold by
Jones Mike Lee and Jones Denise Thomas
Bought by
Shellenberger Evelyn Louise and Derr Pamela Elizabeth
Current Estimated Value
Home Financials for this Owner
Home Financials are based on the most recent Mortgage that was taken out on this home.
Original Mortgage
$240,000
Outstanding Balance
$201,954
Interest Rate
3.92%
Mortgage Type
New Conventional
Estimated Equity
$392,135
Purchase Details
Closed on
Dec 4, 2014
Sold by
Contino Damian G and Contino Laura A
Bought by
Jones Mike Lee and Thomas Jones Sandra Denise
Home Financials for this Owner
Home Financials are based on the most recent Mortgage that was taken out on this home.
Original Mortgage
$130,000
Interest Rate
4.09%
Mortgage Type
New Conventional
Purchase Details
Closed on
Jul 2, 2010
Sold by
Stanford John and Derzawiec Karen
Bought by
Contino Laura A
Create a Home Valuation Report for This Property
The Home Valuation Report is an in-depth analysis detailing your home's value as well as a comparison with similar homes in the area
Home Values in the Area
Average Home Value in this Area
Purchase History
| Date | Buyer | Sale Price | Title Company |
|---|---|---|---|
| Shellenberger Evelyn Louise | $300,000 | None Available | |
| Jones Mike Lee | $285,000 | None Available | |
| Contino Laura A | $220,000 | None Available |
Source: Public Records
Mortgage History
| Date | Status | Borrower | Loan Amount |
|---|---|---|---|
| Open | Shellenberger Evelyn Louise | $240,000 | |
| Previous Owner | Jones Mike Lee | $130,000 |
Source: Public Records
Tax History Compared to Growth
Tax History
| Year | Tax Paid | Tax Assessment Tax Assessment Total Assessment is a certain percentage of the fair market value that is determined by local assessors to be the total taxable value of land and additions on the property. | Land | Improvement |
|---|---|---|---|---|
| 2025 | $3,569 | $469,800 | $120,700 | $349,100 |
| 2024 | $3,338 | $327,300 | $69,000 | $258,300 |
| 2023 | $3,219 | $327,300 | $69,000 | $258,300 |
| 2022 | $3,173 | $327,300 | $69,000 | $258,300 |
| 2021 | $3,132 | $327,300 | $69,000 | $258,300 |
| 2020 | $3,124 | $309,800 | $69,000 | $240,800 |
| 2018 | $2,818 | $285,200 | $69,000 | $216,200 |
| 2017 | $2,711 | $285,200 | $69,000 | $216,200 |
| 2016 | $2,711 | $270,800 | $60,200 | $210,600 |
| 2015 | $2,711 | $270,800 | $60,200 | $210,600 |
| 2014 | $2,664 | $270,800 | $60,200 | $210,600 |
Source: Public Records
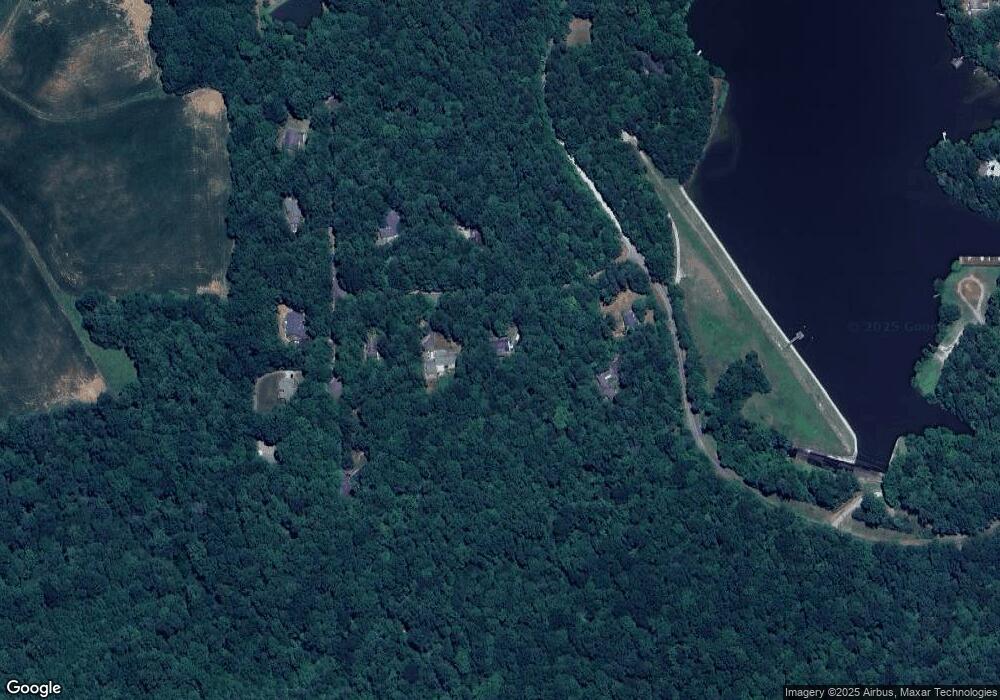
Map
Nearby Homes
- 1028 Lakeview Dr
- 4308 Arrowhead Trail
- 0 Arrowhead Trail
- 4416 Arrowhead Trail
- 714 Sinai Cir
- 605 Canotage Ct
- 0006 Tallulah Loop
- 420 Calvary Ct
- 0009 Tallulah Loop Ln
- 0001 Luke Ln
- Lot 10 Bellechase Rd
- 000 Canaan Cir
- 00 Canaan Cir
- 4 Deer Run Trail
- 2 Deer Run Trail
- 1 Deer Run Trail
- 4524 Ridge Trail
- 2503 N Carolina 86 N
- 4918 Governor Broughton St
- 412 Carr Store Rd
- 1322 Ausling Way
- 1315 Ausling Way Unit 27278
- 1218 Lake Orange Rd Unit 27278
- 1206 Lake Orange Rd
- 4005 Lattimore Dr
- 4017 Lattimore Dr
- 0 Lattimore Dr
- 0000 Lattimore Dr
- 4001 Lattimore Dr
- 4012 Lattimore Dr
- 4004 Lattimore Dr
- 4035 Lattimore Dr
- 4018 Lattimore Dr
- 4030 Lattimore Dr Unit 27278
- 1381 Lake Orange Rd
- 1313 Lake Orange Rd
- 1357 Lake Orange Rd
- 1365 Lake Orange Rd
- 1389 Lake Orange Rd
- 1360 Lake Orange Rd