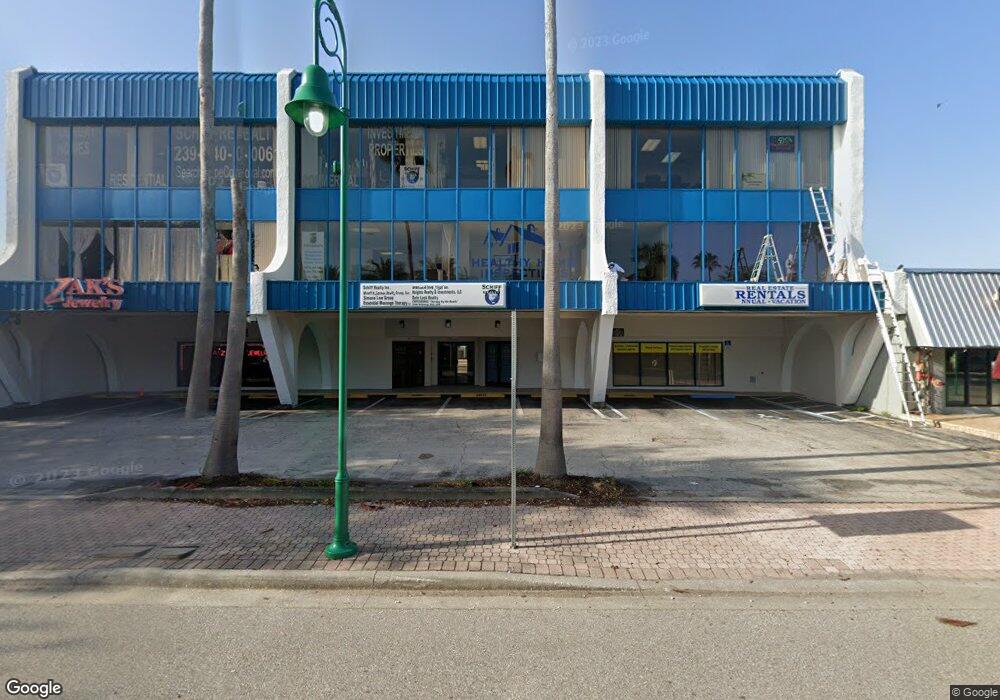
1314 Cape Coral Pkwy E Unit 209 Cape Coral, FL 33904
Caloosahatchee NeighborhoodEstimated Value: $164,051
--
Bed
1
Bath
803
Sq Ft
$204/Sq Ft
Est. Value
About This Home
This home is located at 1314 Cape Coral Pkwy E Unit 209, Cape Coral, FL 33904 and is currently estimated at $164,051, approximately $204 per square foot. 1314 Cape Coral Pkwy E Unit 209 is a home located in Lee County with nearby schools including Cape Elementary School, Caloosa Elementary School, and Tropic Isles Elementary School.
Ownership History
Date
Name
Owned For
Owner Type
Purchase Details
Closed on
Mar 20, 2020
Sold by
Simons Diane M
Bought by
Healthy Home Inspections Incorporated
Current Estimated Value
Purchase Details
Closed on
Oct 8, 2018
Sold by
Simons Diane M
Bought by
Simons Diane M
Purchase Details
Closed on
Dec 6, 2016
Sold by
Simons Diane M and Simons Diane
Bought by
Simons Diane M and Diane M Simons Trust
Purchase Details
Closed on
Sep 30, 2016
Sold by
Lock Dale G
Bought by
Simons Diano
Purchase Details
Closed on
Sep 27, 2013
Sold by
Brandt David M
Bought by
Lock Dale G
Purchase Details
Closed on
Nov 1, 2005
Sold by
Miles Peter and Miles Christine
Bought by
Brandt David M and Lock Dale G
Purchase Details
Closed on
May 14, 2002
Sold by
Miles Christine
Bought by
Miles Christine and Miles Peter
Create a Home Valuation Report for This Property
The Home Valuation Report is an in-depth analysis detailing your home's value as well as a comparison with similar homes in the area
Home Values in the Area
Average Home Value in this Area
Purchase History
| Date | Buyer | Sale Price | Title Company |
|---|---|---|---|
| Healthy Home Inspections Incorporated | $90,000 | Stewart Title Company | |
| Simons Diane M | -- | None Available | |
| Simons Diane M | -- | Attorney | |
| Simons Diano | $79,500 | Best Title Solutions | |
| Lock Dale G | $18,000 | Best Title Solutions Inc | |
| Brandt David M | $189,200 | Island Title Guaranty Agency | |
| Miles Christine | -- | -- |
Source: Public Records
Tax History Compared to Growth
Tax History
| Year | Tax Paid | Tax Assessment Tax Assessment Total Assessment is a certain percentage of the fair market value that is determined by local assessors to be the total taxable value of land and additions on the property. | Land | Improvement |
|---|---|---|---|---|
| 2025 | $2,380 | $110,026 | -- | $110,026 |
| 2024 | $2,380 | $128,866 | -- | $128,866 |
| 2023 | $1,922 | $84,796 | $0 | $0 |
| 2022 | $1,557 | $73,162 | $0 | $73,162 |
| 2021 | $1,441 | $70,079 | $0 | $70,079 |
| 2020 | $1,356 | $63,065 | $0 | $63,065 |
| 2019 | $1,262 | $58,332 | $0 | $58,332 |
| 2018 | $1,388 | $64,240 | $0 | $64,240 |
| 2017 | $1,397 | $64,240 | $0 | $64,240 |
| 2016 | $1,045 | $48,380 | $0 | $48,380 |
| 2015 | $976 | $44,165 | $0 | $44,165 |
| 2014 | $842 | $36,135 | $0 | $36,135 |
| 2013 | -- | $36,135 | $0 | $36,135 |
Source: Public Records
Map
Nearby Homes
- 1437 Vendome Ct
- 817 Lafayette St
- 819 Lafayette St
- 1428 Vendome Ct
- 1105, 1113, 1117 Miramar St
- 0 Access Undetermined SW Unit 224076667
- 4960 Vincennes St
- 1425 Venetian Ct
- 4925 Del Prado Blvd S
- 4903 Vincennes St Unit 116
- 4931 Vincennes Ct Unit 6
- 4931 Vincennes Ct Unit 9
- 1409 SE 46th Ln Unit 105
- 4904 Vincennes St Unit 201
- 4975 Vincennes St Unit A-B
- 1436 Viking Ct
- 4912 Vincennes St Unit 101
- 1326 SE 46th St
- 1220 SE 46th St Unit 101
- 4953 Viceroy St
- 1314 Cape Coral Pkwy E Unit 313
- 1314 Cape Coral Pkwy E Unit 315
- 1314 Cape Coral Pkwy E Unit 208
- 1314 Cape Coral Pkwy E Unit 204
- 1314 Cape Coral Pkwy E Unit 210
- 1314 Cape Coral Pkwy E Unit 203
- 1314 Cape Coral Pkwy E Unit 207
- 1314 Cape Coral Pkwy E Unit 316
- 1314 Cape Coral Pkwy E Unit 314
- 1314 Cape Coral Pkwy E Unit 3**
- 1314 Cape Coral Pkwy E Unit 312
- 1314 Cape Coral Pkwy E Unit 320
- 1314 Cape Coral Pkwy E
- 1314 Cape Coral Pkwy E Unit 311
- 1314 Cape Coral Pkwy E Unit 102
- 1334 Cape Coral Pkwy E
- 1332 Cape Coral Pkwy E
- 1323 Lafayette St Unit A-I
- 1327 Lafayette St
- 1327 Lafayette St Unit C