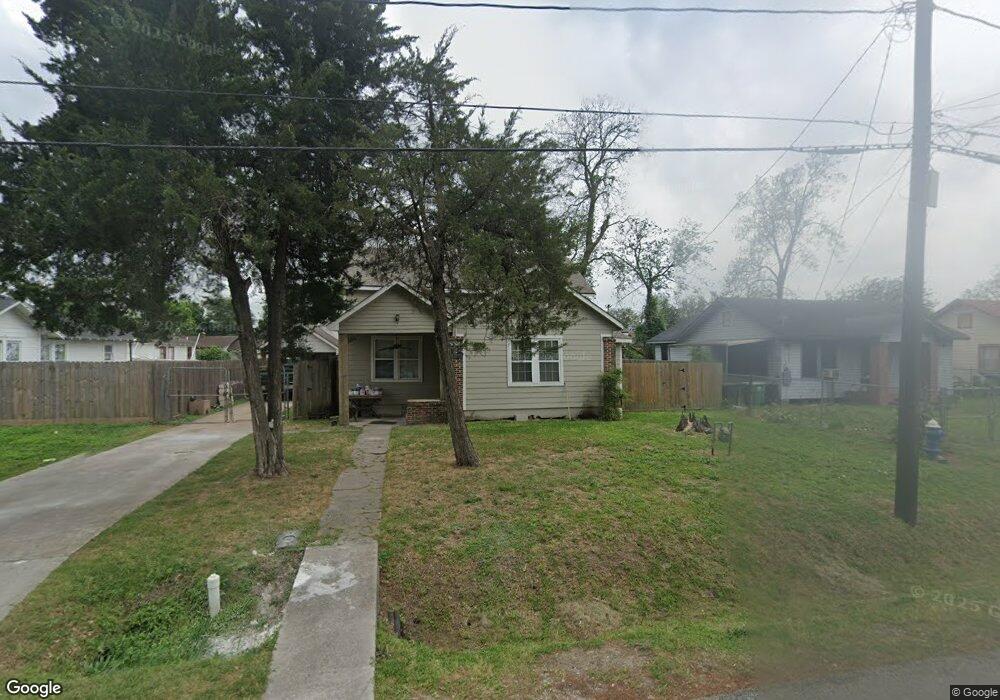
1314 Caplin St Houston, TX 77022
Northside-Northline NeighborhoodEstimated Value: $253,245 - $323,000
3
Beds
2
Baths
1,660
Sq Ft
$171/Sq Ft
Est. Value
About This Home
This home is located at 1314 Caplin St, Houston, TX 77022 and is currently estimated at $284,061, approximately $171 per square foot. 1314 Caplin St is a home located in Harris County with nearby schools including Roosevelt Elementary School, Burbank Middle School, and Northside High School.
Ownership History
Date
Name
Owned For
Owner Type
Purchase Details
Closed on
Jan 17, 1996
Sold by
Volcy Vanice Ray and Volcy Mary A
Bought by
Meza Dagoberto
Current Estimated Value
Home Financials for this Owner
Home Financials are based on the most recent Mortgage that was taken out on this home.
Original Mortgage
$47,607
Outstanding Balance
$1,266
Interest Rate
7.14%
Estimated Equity
$282,795
Create a Home Valuation Report for This Property
The Home Valuation Report is an in-depth analysis detailing your home's value as well as a comparison with similar homes in the area
Home Values in the Area
Average Home Value in this Area
Purchase History
| Date | Buyer | Sale Price | Title Company |
|---|---|---|---|
| Meza Dagoberto | -- | Texas American Title Company |
Source: Public Records
Mortgage History
| Date | Status | Borrower | Loan Amount |
|---|---|---|---|
| Open | Meza Dagoberto | $47,607 |
Source: Public Records
Tax History Compared to Growth
Tax History
| Year | Tax Paid | Tax Assessment Tax Assessment Total Assessment is a certain percentage of the fair market value that is determined by local assessors to be the total taxable value of land and additions on the property. | Land | Improvement |
|---|---|---|---|---|
| 2025 | $2,185 | $221,657 | $131,750 | $89,907 |
| 2024 | $2,185 | $192,894 | $65,875 | $127,019 |
| 2023 | $2,185 | $193,140 | $65,875 | $127,265 |
| 2022 | $3,314 | $161,396 | $65,875 | $95,521 |
| 2021 | $3,189 | $136,817 | $65,875 | $70,942 |
| 2020 | $3,143 | $136,817 | $65,875 | $70,942 |
| 2019 | $2,985 | $136,817 | $65,875 | $70,942 |
| 2018 | $1,880 | $118,048 | $65,875 | $52,173 |
| 2017 | $2,465 | $118,048 | $65,875 | $52,173 |
| 2016 | $2,241 | $118,048 | $65,875 | $52,173 |
| 2015 | $1,335 | $88,437 | $34,584 | $53,853 |
| 2014 | $1,335 | $73,258 | $34,584 | $38,674 |
Source: Public Records
Map
Nearby Homes