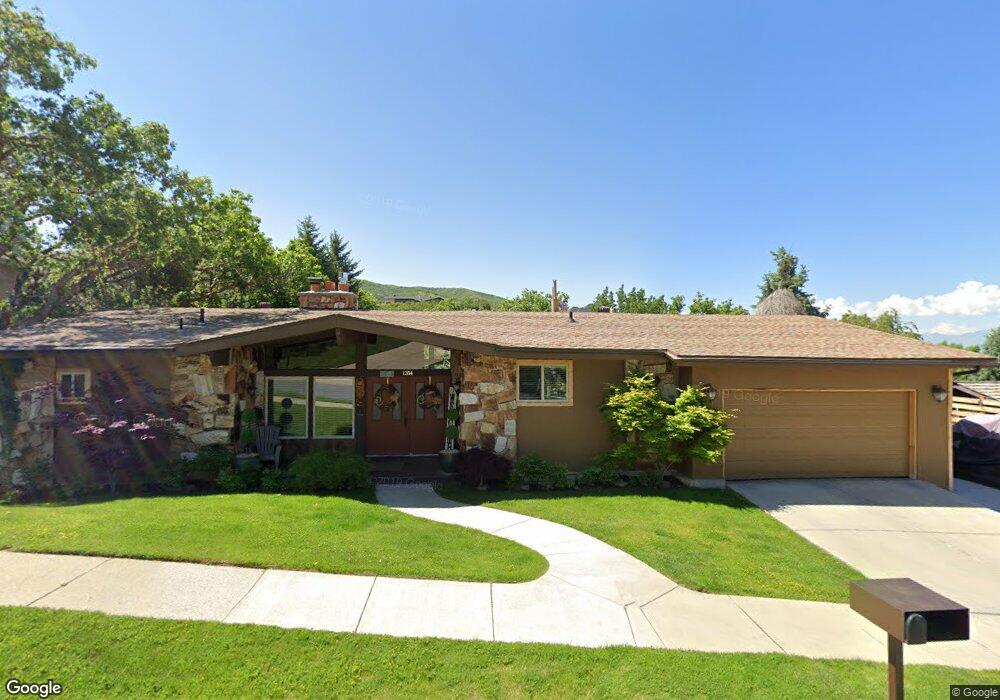
1314 E Millbrook Way Bountiful, UT 84010
Estimated Value: $809,000 - $948,000
5
Beds
3
Baths
4,062
Sq Ft
$213/Sq Ft
Est. Value
About This Home
This home is located at 1314 E Millbrook Way, Bountiful, UT 84010 and is currently estimated at $865,030, approximately $212 per square foot. 1314 E Millbrook Way is a home located in Davis County with nearby schools including Oak Hills School, Millcreek Junior High School, and Bountiful High School.
Ownership History
Date
Name
Owned For
Owner Type
Purchase Details
Closed on
Dec 27, 2019
Sold by
Capson Quinn and Capson Margaret
Bought by
Thueson Jeremy E
Current Estimated Value
Purchase Details
Closed on
Aug 24, 2007
Sold by
Glade Richard W
Bought by
Capson Quinn and Capson Margaret
Purchase Details
Closed on
Dec 29, 1997
Sold by
Southwick Albert J and Southwick Charlotte Nielsen
Bought by
Glade Richard W
Create a Home Valuation Report for This Property
The Home Valuation Report is an in-depth analysis detailing your home's value as well as a comparison with similar homes in the area
Purchase History
| Date | Buyer | Sale Price | Title Company |
|---|---|---|---|
| Thueson Jeremy E | -- | Pinnacle Title Ins | |
| Capson Quinn | -- | Western States Title Company | |
| Glade Richard W | -- | Western States Title Company |
Source: Public Records
Tax History
| Year | Tax Paid | Tax Assessment Tax Assessment Total Assessment is a certain percentage of the fair market value that is determined by local assessors to be the total taxable value of land and additions on the property. | Land | Improvement |
|---|---|---|---|---|
| 2025 | $5,196 | $469,700 | $150,564 | $319,136 |
| 2024 | $4,953 | $447,700 | $137,994 | $309,706 |
| 2023 | $4,658 | $787,000 | $261,215 | $525,785 |
| 2022 | $4,773 | $442,750 | $140,669 | $302,081 |
| 2021 | $4,339 | $618,000 | $210,046 | $407,954 |
| 2020 | $3,790 | $540,000 | $191,005 | $348,995 |
| 2019 | $3,217 | $441,000 | $164,408 | $276,592 |
| 2018 | $3,036 | $409,000 | $155,769 | $253,231 |
| 2016 | $2,736 | $200,420 | $62,412 | $138,008 |
| 2015 | $2,709 | $187,385 | $62,412 | $124,973 |
| 2014 | $2,508 | $177,752 | $62,412 | $115,340 |
| 2013 | -- | $142,932 | $66,842 | $76,090 |
Source: Public Records
Map
Nearby Homes
- 1785 1450 E Unit 604
- 1475 Mueller Park Rd
- 1596 E Millbrook Way
- 1735 S Temple Ct Unit 203
- 1087 Arlington Way
- 1987 Mapleview Dr
- 861 E Millbrook Way
- 1820 S High Pointe Dr
- 795 Abby Ln Unit 5
- 0 Lot Bountiful Blvd
- 2136 Elaine Dr
- 771 E 1825 S
- 1878 E Ridge Point Dr
- 631 E 1700 S
- 1997 S 800 E
- 842 E 2150 S
- 0 Bountiful Blvd
- 1886 S Jeri Dr
- 438 E 1800 S
- 626 E 2150 S
- 1302 E Millbrook Way
- 1324 E Millbrook Way
- 1298 E Millbrook Way
- 1323 E Millbrook Way
- 1336 E Millbrook Way
- 1305 E Millbrook Way
- 1331 E Millbrook Way
- 1296 E Millbrook Way
- 1299 E Millbrook Way
- 1331 E Skyline Dr Unit 47
- 1044 E 300 St S Unit 41
- 608 N 440 E
- 1331 E Skyline Dr
- 1600 E Skyline Dr N
- 2461 S Maple Hills Dr Unit 24
- 1044 E 300 St S
- 1351 E Millbrook Way
- 1360 E Millbrook Way
- 1390 E Millbrook Way
- 1306 Canyon Park Rd
Your Personal Tour Guide
Ask me questions while you tour the home.