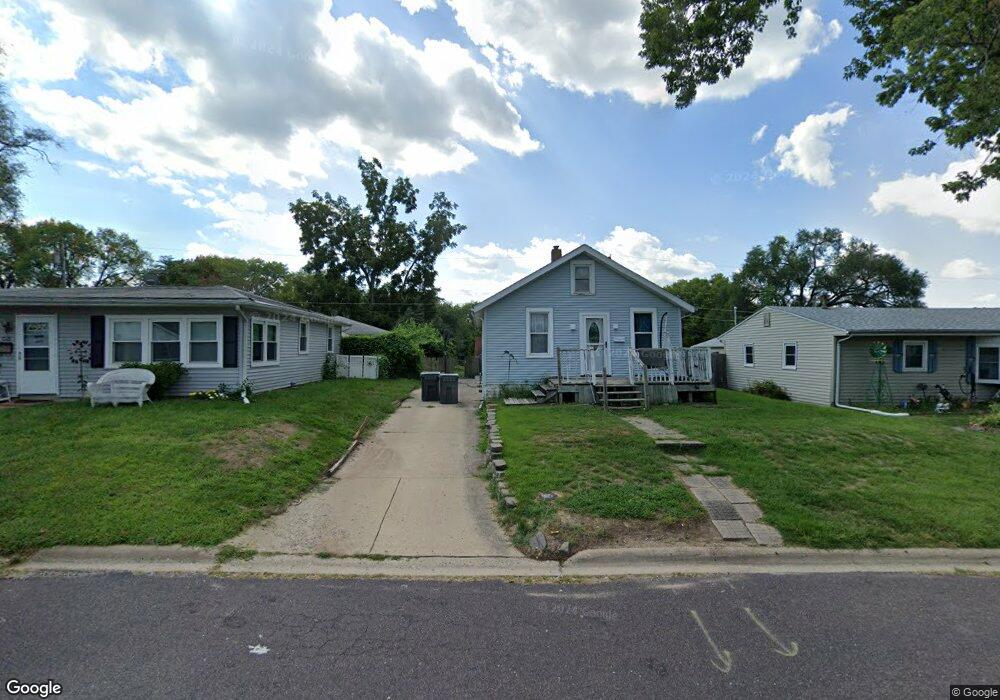
1314 S 12th St Pekin, IL 61554
South of Broadway NeighborhoodEstimated Value: $93,000 - $121,000
2
Beds
1
Bath
1,114
Sq Ft
$97/Sq Ft
Est. Value
About This Home
This home is located at 1314 S 12th St, Pekin, IL 61554 and is currently estimated at $107,708, approximately $96 per square foot. 1314 S 12th St is a home located in Tazewell County with nearby schools including Wilson Intermediate School, Jefferson Elementary School, and Broadmoor Junior High School.
Ownership History
Date
Name
Owned For
Owner Type
Purchase Details
Closed on
Aug 22, 2011
Sold by
Vonderheide Michael H
Bought by
Andrae Jill Lynn
Current Estimated Value
Home Financials for this Owner
Home Financials are based on the most recent Mortgage that was taken out on this home.
Original Mortgage
$76,622
Outstanding Balance
$53,003
Interest Rate
4.55%
Mortgage Type
New Conventional
Estimated Equity
$54,705
Purchase Details
Closed on
Jun 8, 2011
Sold by
Beeney Martha V and Beeney Donald G
Bought by
Vonderheide Michael H
Create a Home Valuation Report for This Property
The Home Valuation Report is an in-depth analysis detailing your home's value as well as a comparison with similar homes in the area
Home Values in the Area
Average Home Value in this Area
Purchase History
| Date | Buyer | Sale Price | Title Company |
|---|---|---|---|
| Andrae Jill Lynn | $80,000 | Chicago Title | |
| Vonderheide Michael H | $50,000 | Hometown Title Pekin |
Source: Public Records
Mortgage History
| Date | Status | Borrower | Loan Amount |
|---|---|---|---|
| Open | Andrae Jill Lynn | $76,622 |
Source: Public Records
Tax History Compared to Growth
Tax History
| Year | Tax Paid | Tax Assessment Tax Assessment Total Assessment is a certain percentage of the fair market value that is determined by local assessors to be the total taxable value of land and additions on the property. | Land | Improvement |
|---|---|---|---|---|
| 2024 | $1,746 | $26,980 | $2,700 | $24,280 |
| 2023 | $1,746 | $25,060 | $2,510 | $22,550 |
| 2022 | $1,605 | $23,370 | $2,340 | $21,030 |
| 2021 | $1,547 | $22,730 | $2,510 | $20,220 |
| 2020 | $1,533 | $22,730 | $2,510 | $20,220 |
| 2019 | $1,512 | $22,730 | $2,510 | $20,220 |
| 2018 | $1,473 | $22,730 | $2,510 | $20,220 |
| 2017 | $1,395 | $22,270 | $2,510 | $19,760 |
| 2016 | $1,445 | $22,800 | $2,470 | $20,330 |
| 2015 | $1,400 | $0 | $0 | $0 |
| 2013 | $1,370 | $22,800 | $2,470 | $20,330 |
Source: Public Records
Map
Nearby Homes