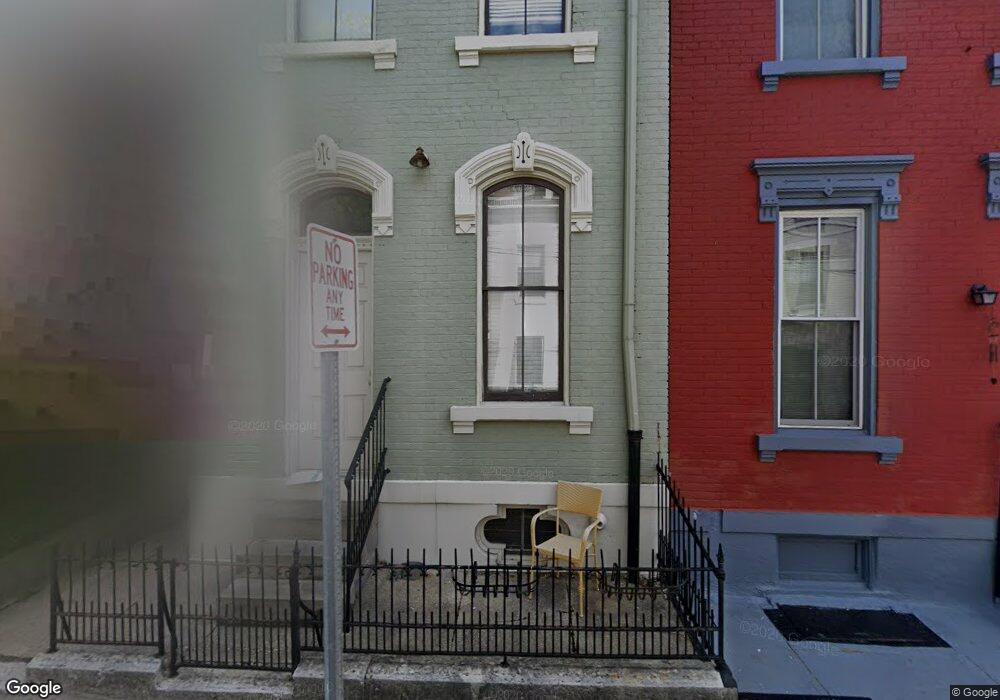
1314 Spring St Cincinnati, OH 45202
Pendleton NeighborhoodEstimated Value: $220,000 - $334,000
1
Bed
2
Baths
796
Sq Ft
$328/Sq Ft
Est. Value
About This Home
This home is located at 1314 Spring St, Cincinnati, OH 45202 and is currently estimated at $260,707, approximately $327 per square foot. 1314 Spring St is a home located in Hamilton County with nearby schools including Rothenberg Preparatory Academy, Robert A. Taft Information Technology High School, and Gilbert A. Dater High School.
Ownership History
Date
Name
Owned For
Owner Type
Purchase Details
Closed on
Sep 27, 2019
Sold by
Kamerer Zachary B
Bought by
Richey Spencer
Current Estimated Value
Home Financials for this Owner
Home Financials are based on the most recent Mortgage that was taken out on this home.
Original Mortgage
$198,075
Outstanding Balance
$171,984
Interest Rate
3.5%
Mortgage Type
New Conventional
Estimated Equity
$88,723
Purchase Details
Closed on
Mar 31, 2015
Sold by
Schneider Nicholas R and Schneider Katie
Bought by
Kamerer Zachary B
Home Financials for this Owner
Home Financials are based on the most recent Mortgage that was taken out on this home.
Original Mortgage
$107,500
Interest Rate
3.73%
Mortgage Type
VA
Purchase Details
Closed on
May 11, 2010
Sold by
Studio 1405 Llc
Bought by
Schneider Nicholas R and Schneider Robert W
Home Financials for this Owner
Home Financials are based on the most recent Mortgage that was taken out on this home.
Original Mortgage
$90,823
Interest Rate
4.75%
Mortgage Type
FHA
Create a Home Valuation Report for This Property
The Home Valuation Report is an in-depth analysis detailing your home's value as well as a comparison with similar homes in the area
Home Values in the Area
Average Home Value in this Area
Purchase History
| Date | Buyer | Sale Price | Title Company |
|---|---|---|---|
| Richey Spencer | $208,500 | None Available | |
| Kamerer Zachary B | $126,000 | Prodigy Title Agency | |
| Schneider Nicholas R | $92,499 | Ltoc |
Source: Public Records
Mortgage History
| Date | Status | Borrower | Loan Amount |
|---|---|---|---|
| Open | Richey Spencer | $198,075 | |
| Previous Owner | Kamerer Zachary B | $107,500 | |
| Previous Owner | Schneider Nicholas R | $90,823 |
Source: Public Records
Tax History
| Year | Tax Paid | Tax Assessment Tax Assessment Total Assessment is a certain percentage of the fair market value that is determined by local assessors to be the total taxable value of land and additions on the property. | Land | Improvement |
|---|---|---|---|---|
| 2025 | $3,602 | $58,573 | $7,875 | $50,698 |
| 2023 | $3,572 | $58,573 | $7,875 | $50,698 |
| 2022 | $4,959 | $72,976 | $10,553 | $62,423 |
| 2021 | $4,775 | $72,976 | $10,553 | $62,423 |
| 2020 | $4,915 | $72,976 | $10,553 | $62,423 |
| 2019 | $3,247 | $44,100 | $7,875 | $36,225 |
| 2018 | $3,251 | $44,100 | $7,875 | $36,225 |
| 2017 | $3,089 | $44,100 | $7,875 | $36,225 |
| 2016 | $2,300 | $32,375 | $3,500 | $28,875 |
| 2015 | $2,073 | $32,375 | $3,500 | $28,875 |
| 2014 | $561 | $32,375 | $3,500 | $28,875 |
| 2013 | $571 | $32,375 | $3,500 | $28,875 |
Source: Public Records
Map
Nearby Homes
- 1314 Spring St
- 1314 Spring St Unit 1
- 1314 Spring St Unit 2
- 1314 Spring St Unit 4
- 1312 Spring St
- 1312 Spring St Unit 1
- 1316 Spring St
- 1306 Spring St
- 1320 Spring St
- 1322 Spring St
- 1324 Spring St
- 1317 Spring St
- 1315 Spring St
- 1319 Spring St
- 1326 Spring St
- 1313 Spring St
- 1304 Spring St
- 416 E 13th St
- 1328 Spring St
- 1323 Pendleton St
Your Personal Tour Guide
Ask me questions while you tour the home.