1315 21st St Columbus, GA 31901
East Highlands NeighborhoodEstimated Value: $81,000 - $126,000
3
Beds
2
Baths
1,490
Sq Ft
$67/Sq Ft
Est. Value
About This Home
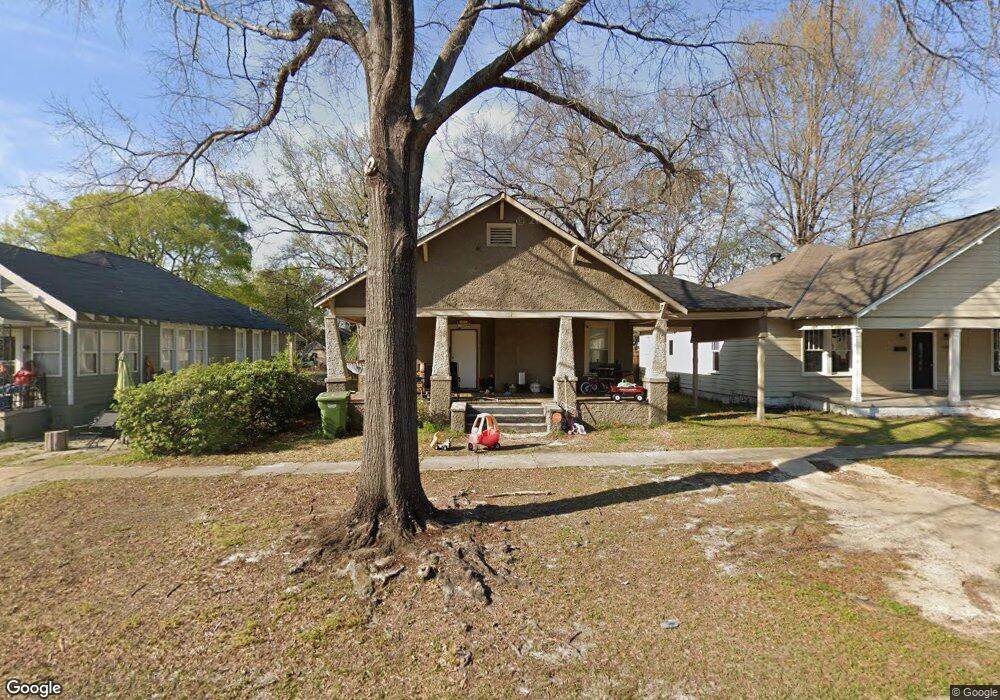
This home is located at 1315 21st St, Columbus, GA 31901 and is currently estimated at $100,114, approximately $67 per square foot. 1315 21st St is a home located in Muscogee County with nearby schools including Arnold Middle School, Jordan Vocational High School, and Wynnton Elementary School.
Ownership History
Date
Name
Owned For
Owner Type
Purchase Details
Closed on
Mar 6, 2024
Sold by
Home Investments Inc
Bought by
Sbd Props Llc
Current Estimated Value
Purchase Details
Closed on
Dec 14, 2018
Sold by
Sbd Properties Llc
Bought by
Home Investments Inc
Purchase Details
Closed on
Apr 9, 2015
Sold by
Capstone Real Estate Solut
Bought by
Cf Properties Llc
Purchase Details
Closed on
Apr 8, 2015
Sold by
Cf Properties Llc
Bought by
Sbd Properties Llc
Purchase Details
Closed on
Sep 21, 2013
Sold by
Harbour Grp Inc
Bought by
Capstone Real Estate Solutions
Purchase Details
Closed on
Jun 19, 2013
Sold by
Bt Sale Llc
Bought by
Harbour Grp Inc
Purchase Details
Closed on
Oct 29, 2012
Sold by
Manning Coby
Bought by
Bt Sale Llc
Purchase Details
Closed on
Aug 27, 2011
Sold by
Flat Rock Rental Holding C
Bought by
Manning Coby
Create a Home Valuation Report for This Property
The Home Valuation Report is an in-depth analysis detailing your home's value as well as a comparison with similar homes in the area
Home Values in the Area
Average Home Value in this Area
Purchase History
| Date | Buyer | Sale Price | Title Company |
|---|---|---|---|
| Sbd Props Llc | $10,000 | None Listed On Document | |
| Home Investments Inc | $10,000 | -- | |
| Cf Properties Llc | $25,000 | -- | |
| Sbd Properties Llc | $32,500 | -- | |
| Capstone Real Estate Solutions | -- | -- | |
| Harbour Grp Inc | $25,800 | -- | |
| Bt Sale Llc | -- | -- | |
| Manning Coby | $31,130 | -- |
Source: Public Records
Tax History Compared to Growth
Tax History
| Year | Tax Paid | Tax Assessment Tax Assessment Total Assessment is a certain percentage of the fair market value that is determined by local assessors to be the total taxable value of land and additions on the property. | Land | Improvement |
|---|---|---|---|---|
| 2025 | $724 | $51,004 | $7,756 | $43,248 |
| 2024 | -- | $18,496 | $7,756 | $10,740 |
| 2023 | $729 | $18,496 | $7,756 | $10,740 |
| 2022 | $372 | $18,496 | $7,756 | $10,740 |
| 2021 | $372 | $9,108 | $7,756 | $1,352 |
| 2020 | $372 | $28,884 | $7,756 | $21,128 |
| 2019 | $164 | $4,000 | $1,040 | $2,960 |
| 2018 | $970 | $23,672 | $7,756 | $15,916 |
| 2017 | $308 | $31,092 | $7,756 | $23,336 |
| 2016 | $309 | $7,492 | $1,589 | $5,903 |
| 2015 | $203 | $12,258 | $2,600 | $9,658 |
| 2014 | $73 | $4,438 | $2,600 | $1,838 |
| 2013 | -- | $9,312 | $2,600 | $6,712 |
Source: Public Records
Map
Nearby Homes