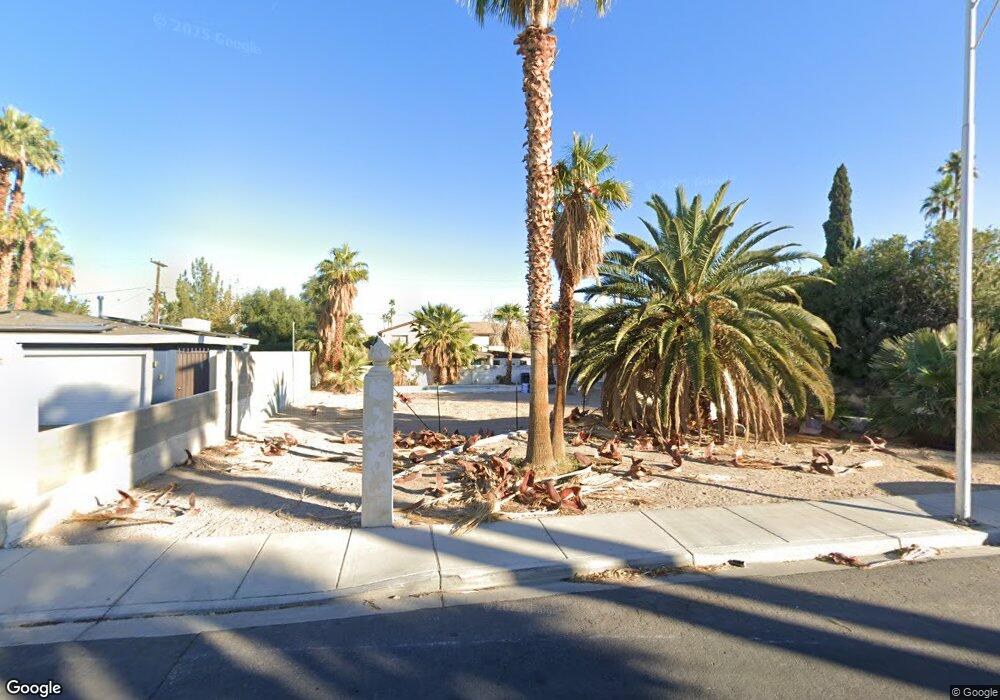
1315 5th Place Las Vegas, NV 89104
Huntridge NeighborhoodEstimated Value: $341,000 - $417,000
3
Beds
3
Baths
1,812
Sq Ft
$217/Sq Ft
Est. Value
About This Home
This home is located at 1315 5th Place, Las Vegas, NV 89104 and is currently estimated at $392,514, approximately $216 per square foot. 1315 5th Place is a home located in Clark County with nearby schools including John S Park Elementary School, Roy West Martin Middle School, and Valley High School.
Ownership History
Date
Name
Owned For
Owner Type
Purchase Details
Closed on
Jan 28, 2002
Sold by
Wallace Dennis H
Bought by
Wallace Derek
Current Estimated Value
Home Financials for this Owner
Home Financials are based on the most recent Mortgage that was taken out on this home.
Original Mortgage
$120,000
Outstanding Balance
$52,444
Interest Rate
7.87%
Mortgage Type
Unknown
Estimated Equity
$340,070
Purchase Details
Closed on
Jan 19, 2001
Sold by
J A Barker & Associates Inc
Bought by
Wallace Dennis H
Home Financials for this Owner
Home Financials are based on the most recent Mortgage that was taken out on this home.
Original Mortgage
$25,000
Interest Rate
7.54%
Mortgage Type
Seller Take Back
Purchase Details
Closed on
Jan 18, 2001
Sold by
Wallace Janet L
Bought by
Wallace Dennis H
Home Financials for this Owner
Home Financials are based on the most recent Mortgage that was taken out on this home.
Original Mortgage
$25,000
Interest Rate
7.54%
Mortgage Type
Seller Take Back
Purchase Details
Closed on
Nov 2, 2000
Sold by
Aubuchon Perry J
Bought by
J A Barker & Associates Inc
Create a Home Valuation Report for This Property
The Home Valuation Report is an in-depth analysis detailing your home's value as well as a comparison with similar homes in the area
Home Values in the Area
Average Home Value in this Area
Purchase History
| Date | Buyer | Sale Price | Title Company |
|---|---|---|---|
| Wallace Derek | $150,000 | Fidelity National Title | |
| Wallace Dennis H | $115,000 | Land Title | |
| Wallace Dennis H | -- | Land Title | |
| J A Barker & Associates Inc | $100,000 | Land Title |
Source: Public Records
Mortgage History
| Date | Status | Borrower | Loan Amount |
|---|---|---|---|
| Open | Wallace Derek | $120,000 | |
| Closed | Wallace Dennis H | $25,000 |
Source: Public Records
Tax History Compared to Growth
Tax History
| Year | Tax Paid | Tax Assessment Tax Assessment Total Assessment is a certain percentage of the fair market value that is determined by local assessors to be the total taxable value of land and additions on the property. | Land | Improvement |
|---|---|---|---|---|
| 2025 | $850 | $45,735 | $36,400 | $9,335 |
| 2024 | $826 | $45,735 | $36,400 | $9,335 |
| 2023 | $826 | $50,521 | $42,350 | $8,171 |
| 2022 | $879 | $37,587 | $30,100 | $7,487 |
| 2021 | $814 | $36,660 | $29,750 | $6,910 |
| 2020 | $753 | $47,944 | $31,150 | $16,794 |
| 2019 | $705 | $41,731 | $25,550 | $16,181 |
| 2018 | $673 | $38,080 | $22,750 | $15,330 |
| 2017 | $1,109 | $33,835 | $18,550 | $15,285 |
| 2016 | $905 | $29,325 | $14,700 | $14,625 |
| 2015 | $898 | $26,256 | $12,250 | $14,006 |
| 2014 | $952 | $18,033 | $7,350 | $10,683 |
Source: Public Records
Map
Nearby Homes
- 1234 5th Place
- 1420 S 8th St
- 1212 S 7th St
- 1303 S 8th St
- 1414 Rexford Place
- 619 Park Paseo
- 1502 Rexford Place
- 556 E Oakey Blvd
- 1506 Rexford Place
- 1707 Santa Paula Dr
- 1811 S 7th St
- 900 Las Vegas Blvd S Unit 1403
- 900 Las Vegas Blvd S Unit 1113
- 900 Las Vegas Blvd S Unit 1012
- 900 Las Vegas Blvd S Unit 912
- 900 Las Vegas Blvd S Unit 715
- 900 Las Vegas Blvd S Unit 903
- 1008 S 3rd St
- 1808 Weldon Place
- 1020 Wengert Ave