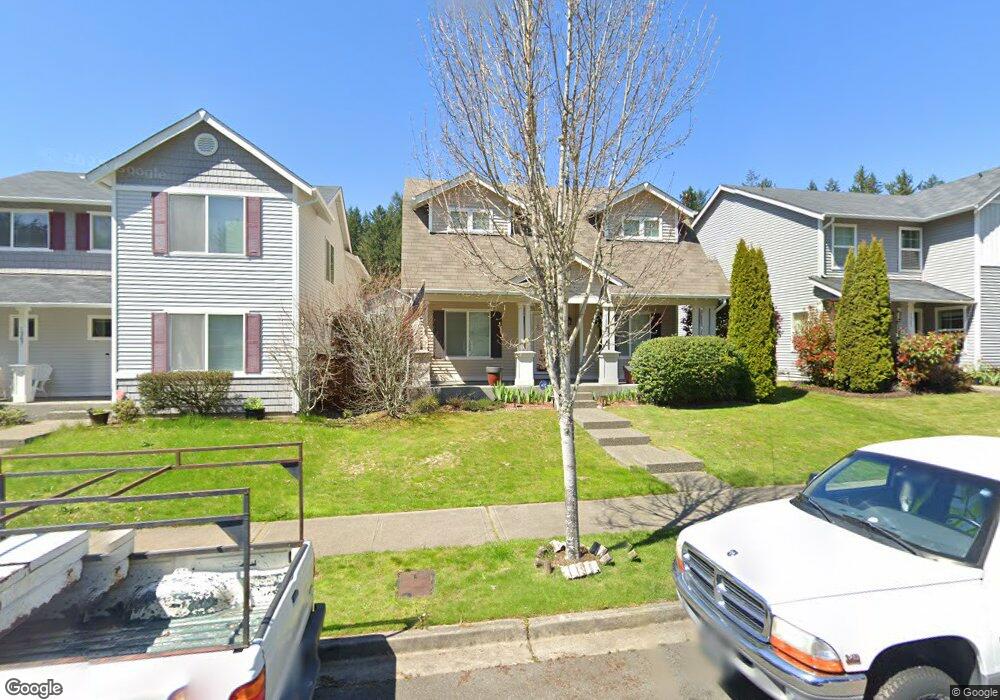
1315 Burnside Place Dupont, WA 98327
Estimated Value: $544,243 - $589,000
4
Beds
3
Baths
2,074
Sq Ft
$275/Sq Ft
Est. Value
About This Home
This home is located at 1315 Burnside Place, Dupont, WA 98327 and is currently estimated at $571,061, approximately $275 per square foot. 1315 Burnside Place is a home located in Pierce County with nearby schools including Chloe Clark Elementary School, Saltars Point Elementary School, and Pioneer Middle School.
Ownership History
Date
Name
Owned For
Owner Type
Purchase Details
Closed on
Jan 17, 2017
Sold by
Kim Habakkuk Daehan and Kim Linh Thu T
Bought by
Kim Linh Thu T
Current Estimated Value
Home Financials for this Owner
Home Financials are based on the most recent Mortgage that was taken out on this home.
Original Mortgage
$286,020
Interest Rate
4.13%
Mortgage Type
VA
Purchase Details
Closed on
Mar 2, 2012
Sold by
Weatherly John M and Weatherly Dana C
Bought by
Kim Linh Thu and Kim Habbakkuk Daehan
Home Financials for this Owner
Home Financials are based on the most recent Mortgage that was taken out on this home.
Original Mortgage
$315,131
Interest Rate
3.83%
Mortgage Type
VA
Purchase Details
Closed on
Jun 1, 2009
Sold by
The Quadrant Corporation
Bought by
Weatherly John M and Weatherly Dana C
Home Financials for this Owner
Home Financials are based on the most recent Mortgage that was taken out on this home.
Original Mortgage
$297,350
Interest Rate
4.78%
Mortgage Type
VA
Create a Home Valuation Report for This Property
The Home Valuation Report is an in-depth analysis detailing your home's value as well as a comparison with similar homes in the area
Home Values in the Area
Average Home Value in this Area
Purchase History
| Date | Buyer | Sale Price | Title Company |
|---|---|---|---|
| Kim Linh Thu T | -- | First American Title Ins Co | |
| Kim Linh Thu | $308,500 | Old Republic Title Ltd | |
| Weatherly John M | $291,129 | Chicago Title |
Source: Public Records
Mortgage History
| Date | Status | Borrower | Loan Amount |
|---|---|---|---|
| Open | Kim Linh Thu T | $286,020 | |
| Closed | Kim Linh Thu | $315,131 | |
| Previous Owner | Weatherly John M | $297,350 |
Source: Public Records
Tax History Compared to Growth
Tax History
| Year | Tax Paid | Tax Assessment Tax Assessment Total Assessment is a certain percentage of the fair market value that is determined by local assessors to be the total taxable value of land and additions on the property. | Land | Improvement |
|---|---|---|---|---|
| 2025 | $3,764 | $517,400 | $213,500 | $303,900 |
| 2024 | $3,764 | $493,300 | $205,700 | $287,600 |
| 2023 | $3,764 | $467,700 | $193,200 | $274,500 |
| 2022 | $3,748 | $476,500 | $193,200 | $283,300 |
| 2021 | $3,561 | $353,600 | $122,700 | $230,900 |
| 2019 | $3,163 | $322,000 | $102,300 | $219,700 |
| 2018 | $3,397 | $309,300 | $102,300 | $207,000 |
| 2017 | $3,050 | $291,000 | $87,100 | $203,900 |
| 2016 | $2,910 | $261,400 | $73,400 | $188,000 |
| 2014 | $2,791 | $258,500 | $73,400 | $185,100 |
| 2013 | $2,791 | $236,200 | $75,200 | $161,000 |
Source: Public Records
Map
Nearby Homes
- 1335 Foreman Rd
- 1375 Foreman Rd
- 3073 Hoffman Hill Blvd
- 1162 Swan Loop
- 3178 Hoffman Hill Blvd
- 3202 Hoffman Hill Blvd
- 1788 Cadborough Ln
- 3412 Hoffman Hill Blvd
- 1061 Hiton Cir
- 2702 Meyer St
- 32 Madrona Place
- 2357 Wallace St
- 2420 Simmons St
- 1821 Mcneil Cir Unit D-3
- 1875 Mcneil Cir Unit E-1
- 2055 Garry Oaks Ave Unit B
- 1856 Spencer Ct Unit 12F
- 1607 Kincaid St Unit E-8
- 2176 McDonald Ave
- 1449 Bobs Hollow Ln
- 1287 Burnside Place
- 1323 Burnside Place
- 1349 Burnside Place
- 1279 Burnside Place
- 1225 Burnside Place
- 1223 Burnside Place
- 1357 Burnside Place
- 1273 Burnside Place
- 1221 Burnside Place
- 1227 Burnside Place
- 1320 Burnside Place
- 1219 Burnside Place
- 1338 Burnside Place
- 1282 Burnside Place
- 1231 Burnside Place
- 1267 Burnside Place
- 1217 Burnside Place
- 1276 Burnside Place
- 1233 Burnside Place
- 1215 Burnside Place