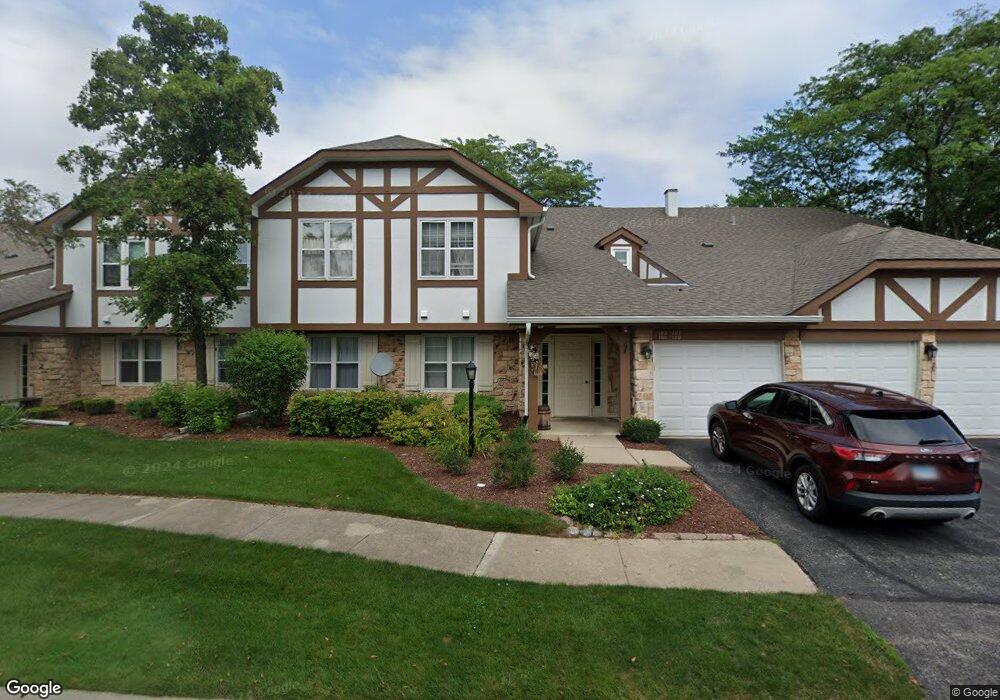
1315 Coventry Cir Unit 239 Vernon Hills, IL 60061
Estimated Value: $263,000 - $307,000
--
Bed
2
Baths
1,246
Sq Ft
$228/Sq Ft
Est. Value
About This Home
This home is located at 1315 Coventry Cir Unit 239, Vernon Hills, IL 60061 and is currently estimated at $284,692, approximately $228 per square foot. 1315 Coventry Cir Unit 239 is a home located in Lake County with nearby schools including Hawthorn School Of Dual Language, Hawthorn Townline Elementary School, and Hawthorn Middle School North.
Ownership History
Date
Name
Owned For
Owner Type
Purchase Details
Closed on
May 26, 2006
Sold by
Goldstein Ilene F and Cesar Maria Rose
Bought by
Phengphipat Charal and Phengphipat Susan
Current Estimated Value
Home Financials for this Owner
Home Financials are based on the most recent Mortgage that was taken out on this home.
Original Mortgage
$125,000
Outstanding Balance
$72,166
Interest Rate
6.25%
Mortgage Type
Purchase Money Mortgage
Estimated Equity
$212,526
Purchase Details
Closed on
Jul 3, 1997
Sold by
Boone Florence H
Bought by
Cesar Maria R
Home Financials for this Owner
Home Financials are based on the most recent Mortgage that was taken out on this home.
Original Mortgage
$92,800
Interest Rate
8%
Mortgage Type
Purchase Money Mortgage
Purchase Details
Closed on
Jun 21, 1995
Sold by
Green Willis Ginger S and Willis Allen P
Bought by
Boone Florence H
Create a Home Valuation Report for This Property
The Home Valuation Report is an in-depth analysis detailing your home's value as well as a comparison with similar homes in the area
Home Values in the Area
Average Home Value in this Area
Purchase History
| Date | Buyer | Sale Price | Title Company |
|---|---|---|---|
| Phengphipat Charal | $174,500 | St | |
| Cesar Maria R | $116,000 | -- | |
| Boone Florence H | $111,000 | First American Title |
Source: Public Records
Mortgage History
| Date | Status | Borrower | Loan Amount |
|---|---|---|---|
| Open | Phengphipat Charal | $125,000 | |
| Previous Owner | Cesar Maria R | $92,800 |
Source: Public Records
Tax History Compared to Growth
Tax History
| Year | Tax Paid | Tax Assessment Tax Assessment Total Assessment is a certain percentage of the fair market value that is determined by local assessors to be the total taxable value of land and additions on the property. | Land | Improvement |
|---|---|---|---|---|
| 2024 | $3,725 | $70,382 | $25,980 | $44,402 |
| 2023 | $4,188 | $64,916 | $23,962 | $40,954 |
| 2022 | $4,188 | $58,627 | $23,033 | $35,594 |
| 2021 | $4,100 | $57,365 | $22,537 | $34,828 |
| 2020 | $4,071 | $56,400 | $22,158 | $34,242 |
| 2019 | $3,971 | $55,863 | $21,947 | $33,916 |
| 2018 | $3,584 | $47,382 | $21,857 | $25,525 |
| 2017 | $3,524 | $45,886 | $21,167 | $24,719 |
| 2016 | $3,361 | $43,506 | $20,069 | $23,437 |
| 2015 | $3,286 | $40,664 | $18,758 | $21,906 |
| 2014 | $3,324 | $38,888 | $18,506 | $20,382 |
| 2012 | $3,827 | $40,540 | $18,667 | $21,873 |
Source: Public Records
Map
Nearby Homes
- 215 Coventry Cir Unit 215
- 240 Southwick Ct Unit 52
- 370 Bay Tree Cir
- 410 Bay Tree Cir
- 11 Echo Ct Unit 5
- 1620 Nicklaus Ct
- 1000 Centurion Ln Unit 4
- 561 Saddlebrook Ln Unit 161
- 513 Saddlebrook Ln Unit 4
- 1049 Kingston Ct
- 15 Crestview Ln Unit 4
- 1109 Grant Place
- 1855 Lake Charles Dr
- 1028 Cumberland Ct
- 1875 Lake Charles Dr
- 1654 Pebble Beach Way
- 1933 Lake Charles Dr
- 1939 Lake Charles Dr
- 1952 Crenshaw Cir Unit 193
- 139 Windsor Dr Unit 123
- 1313 Coventry Cir Unit 238
- 1323 Coventry Cir Unit 234
- 1325 Coventry Cir Unit 235
- 1327 Coventry Cir Unit 236
- 1307 Coventry Cir Unit 276
- 1322 Coventry Cir Unit 230
- 1326 Coventry Cir Unit 232
- 197 Hemingway Ct Unit 264
- 187 Hemingway Ct Unit 260
- 183 Hemingway Ct Unit 258
- 181 Hemingway Ct Unit 257
- 1332 Coventry Cir Unit 226
- 1257 N Regency Dr Unit 13
- 1241 N Regency Dr Unit 5
- 1251 N Regency Dr Unit 16
- 1253 N Regency Dr Unit 15
- 1265 N Regency Dr Unit 14
- 1261 N Regency Dr Unit 12
- 1263 N Regency Dr Unit 11
- 1255 N Regency Dr Unit 10