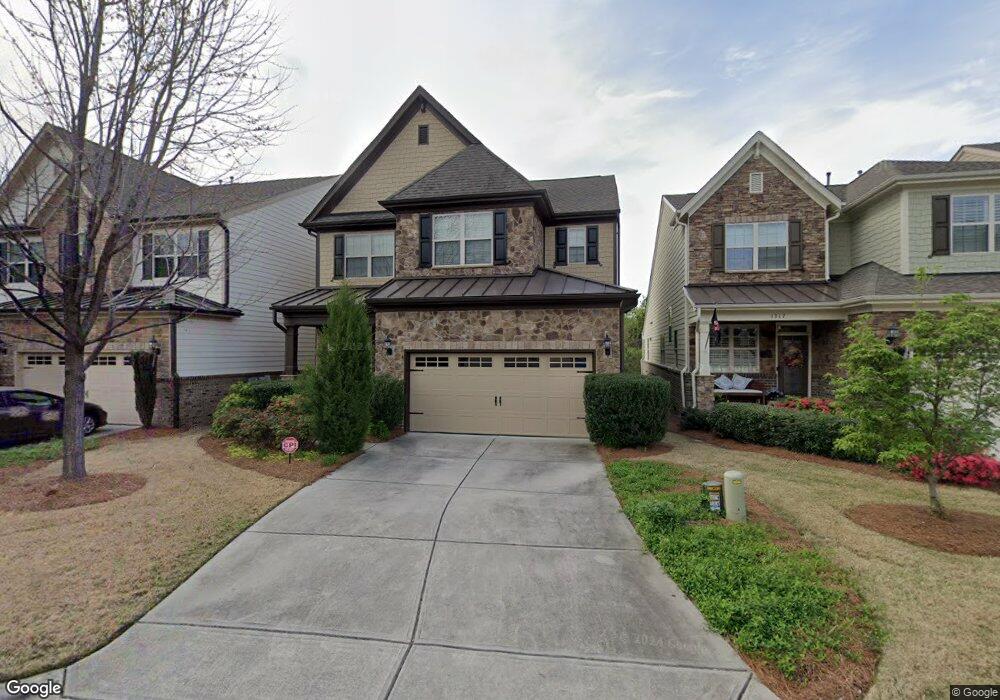
1315 English Cottage Ln Unit 82 Cary, NC 27518
Middle Creek NeighborhoodEstimated Value: $743,000 - $812,000
4
Beds
3
Baths
2,867
Sq Ft
$269/Sq Ft
Est. Value
About This Home
This home is located at 1315 English Cottage Ln Unit 82, Cary, NC 27518 and is currently estimated at $769,855, approximately $268 per square foot. 1315 English Cottage Ln Unit 82 is a home located in Wake County with nearby schools including Penny Road Elementary School, Dillard Drive Magnet Middle School, and TMSA Triangle - Triangle Math and Science Academy.
Ownership History
Date
Name
Owned For
Owner Type
Purchase Details
Closed on
Mar 21, 2024
Sold by
First-Citizens Bk & Tr Company and Rajaraman Revathy
Bought by
Mclean Bradley and Mclean Shannon
Current Estimated Value
Home Financials for this Owner
Home Financials are based on the most recent Mortgage that was taken out on this home.
Original Mortgage
$679,250
Outstanding Balance
$668,246
Interest Rate
6.77%
Mortgage Type
New Conventional
Estimated Equity
$101,609
Purchase Details
Closed on
Dec 7, 2011
Sold by
Foreverhome Llc
Bought by
Skulavik Patricia Yabes and Skulavik Daniel
Home Financials for this Owner
Home Financials are based on the most recent Mortgage that was taken out on this home.
Original Mortgage
$346,410
Interest Rate
4.15%
Mortgage Type
New Conventional
Purchase Details
Closed on
Nov 12, 2010
Sold by
Regency Investment Group Llc
Bought by
Foreverhome Llc
Create a Home Valuation Report for This Property
The Home Valuation Report is an in-depth analysis detailing your home's value as well as a comparison with similar homes in the area
Home Values in the Area
Average Home Value in this Area
Purchase History
| Date | Buyer | Sale Price | Title Company |
|---|---|---|---|
| Mclean Bradley | $715,000 | None Listed On Document | |
| Skulavik Patricia Yabes | $385,000 | None Available | |
| Foreverhome Llc | $660,000 | None Available |
Source: Public Records
Mortgage History
| Date | Status | Borrower | Loan Amount |
|---|---|---|---|
| Open | Mclean Bradley | $679,250 | |
| Previous Owner | Skulavik Patricia Yabes | $346,410 |
Source: Public Records
Tax History Compared to Growth
Tax History
| Year | Tax Paid | Tax Assessment Tax Assessment Total Assessment is a certain percentage of the fair market value that is determined by local assessors to be the total taxable value of land and additions on the property. | Land | Improvement |
|---|---|---|---|---|
| 2025 | $5,936 | $690,196 | $190,000 | $500,196 |
| 2024 | $5,807 | $690,196 | $190,000 | $500,196 |
| 2023 | $4,812 | $478,244 | $110,000 | $368,244 |
| 2022 | $4,633 | $478,244 | $110,000 | $368,244 |
| 2021 | $4,539 | $478,244 | $110,000 | $368,244 |
| 2020 | $4,563 | $478,244 | $110,000 | $368,244 |
| 2019 | $4,605 | $428,195 | $110,000 | $318,195 |
| 2018 | $4,321 | $428,195 | $110,000 | $318,195 |
| 2017 | $4,152 | $428,195 | $110,000 | $318,195 |
| 2016 | $4,090 | $428,195 | $110,000 | $318,195 |
| 2015 | $4,330 | $437,760 | $128,000 | $309,760 |
| 2014 | $4,082 | $437,760 | $128,000 | $309,760 |
Source: Public Records
Map
Nearby Homes
- 957 Regency Cottage Place
- 656 Angelica Cir
- 644 Angelica Cir
- 1020 Regency Cottage Place
- 115 Kelekent Ln
- 207 Devonbrook Ln
- 114 Kendleton Place
- 1414 Waterford Green Dr
- 2002 Red Sage Ct
- 1209 Waterford Green Dr
- 101 Saint Brides Ct
- 329 Lady Marian Ct
- 101 Lions Gate Dr
- 2014 Waterton Ln
- 2102 Watersglen Dr
- 200 Lions Gate Dr
- 204 Oxford Mill Ct
- 1811 Green Ford Ln
- 10917 Bexhill Dr
- 1204 Queensferry Rd
- 1315 English Cottage Ln
- 1317 English Cottage Ln
- 1313 English Cottage Ln
- 1319 English Cottage Ln Unit 84
- 1319 English Cottage Ln
- 1311 English Cottage Ln
- 1321 English Cottage Ln
- 1321 English Cottage Ln Unit 85
- 1323 English Cottage Ln
- 1316 English Cottage Ln
- 1314 English Cottage Ln
- 1312 English Cottage Ln
- 1307 English Cottage Ln Unit 79
- 1318 English Cottage Ln Unit 122
- 1318 English Cottage Ln
- 1320 English Cottage Ln Unit 121
- 1305 English Cottage Ln
- 1322 English Cottage Ln Unit 76
- 1322 English Cottage Ln
- 1327 English Cottage Ln