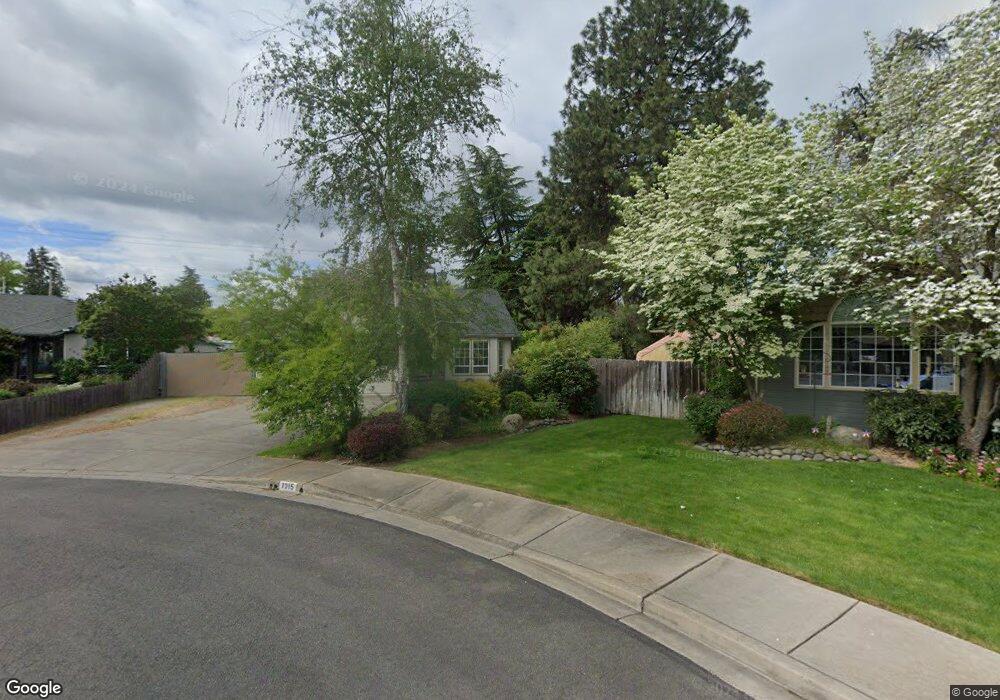
1315 Magruder Ct Central Point, OR 97502
Estimated Value: $448,380 - $482,000
3
Beds
2
Baths
1,950
Sq Ft
$240/Sq Ft
Est. Value
About This Home
This home is located at 1315 Magruder Ct, Central Point, OR 97502 and is currently estimated at $467,095, approximately $239 per square foot. 1315 Magruder Ct is a home located in Jackson County with nearby schools including Howard Elementary School, McLoughlin Middle School, and North Medford High School.
Ownership History
Date
Name
Owned For
Owner Type
Purchase Details
Closed on
May 2, 2018
Sold by
Davis Kelly and Kerns Kelly J
Bought by
Kerns Living Trust and Kerns
Current Estimated Value
Purchase Details
Closed on
Apr 12, 2018
Sold by
Davis Kelly and Kerns Kelly Jo
Bought by
Kerns Robert D and Kerns Kelly Jo
Purchase Details
Closed on
Jun 4, 2008
Sold by
Frazier Timmy L and Frazier Denise M
Bought by
Davis Kelly
Home Financials for this Owner
Home Financials are based on the most recent Mortgage that was taken out on this home.
Original Mortgage
$183,000
Interest Rate
6.04%
Mortgage Type
Purchase Money Mortgage
Purchase Details
Closed on
Sep 18, 1998
Sold by
Forrestal William C and Forrestal Jacquelyn L
Bought by
Frazier Timmy L and Frazier Denise M
Home Financials for this Owner
Home Financials are based on the most recent Mortgage that was taken out on this home.
Original Mortgage
$123,300
Interest Rate
6.88%
Create a Home Valuation Report for This Property
The Home Valuation Report is an in-depth analysis detailing your home's value as well as a comparison with similar homes in the area
Home Values in the Area
Average Home Value in this Area
Purchase History
| Date | Buyer | Sale Price | Title Company |
|---|---|---|---|
| Kerns Living Trust | -- | None Listed On Document | |
| Kerns Robert D | -- | None Available | |
| Davis Kelly | $293,000 | Lawyers Title Ins | |
| Frazier Timmy L | $138,000 | Key Title Company |
Source: Public Records
Mortgage History
| Date | Status | Borrower | Loan Amount |
|---|---|---|---|
| Previous Owner | Davis Kelly | $183,000 | |
| Previous Owner | Frazier Timmy L | $123,300 |
Source: Public Records
Tax History Compared to Growth
Tax History
| Year | Tax Paid | Tax Assessment Tax Assessment Total Assessment is a certain percentage of the fair market value that is determined by local assessors to be the total taxable value of land and additions on the property. | Land | Improvement |
|---|---|---|---|---|
| 2025 | $4,140 | $247,430 | $69,280 | $178,150 |
| 2024 | $4,140 | $240,230 | $67,270 | $172,960 |
| 2023 | $4,014 | $233,240 | $65,310 | $167,930 |
| 2022 | $3,913 | $233,240 | $65,310 | $167,930 |
| 2021 | $3,837 | $226,450 | $63,410 | $163,040 |
| 2020 | $3,715 | $219,860 | $61,560 | $158,300 |
| 2019 | $3,624 | $207,250 | $58,020 | $149,230 |
| 2018 | $3,529 | $201,220 | $56,330 | $144,890 |
| 2017 | $3,459 | $201,220 | $56,330 | $144,890 |
| 2016 | $3,385 | $189,670 | $53,100 | $136,570 |
| 2015 | $3,254 | $189,670 | $53,100 | $136,570 |
| 2014 | $3,194 | $178,790 | $50,050 | $128,740 |
Source: Public Records
Map
Nearby Homes
- 881 Westrop Dr
- 745 Herman Ave
- 3358 Bursell Rd
- 659 Herman Ave
- 3364 Bursell Rd
- 2825 Duell Ave
- 1065 Edwina Ave
- 3600 N Pacific Hwy
- 921 Pittview Ave
- 3496 Edella St
- 3119 Merriman Rd
- 2711 Elliott Ave
- 2825 Howard Ave
- 851 Juanita Way
- 1017 Fairfield Ave
- 191 Mellecker Way
- 199 Mellecker Way
- 1025 Fairfield Ave
- 1060 Hopkins Rd
- 887 Silver Fox Dr
- 1317 Magruder Ct
- 1313 Magruder Ct
- 744 Beall Ln
- 744 "B" Beall Ln
- 744 1/2 Beall Ln
- 1316 Magruder Ct
- 1311 Magruder Ct
- 1382 Heather Ln
- 1362 Heather Ln
- 1312 Magruder Ct
- 1324 Heather Ln
- 1309 Magruder Ct
- 727 Beall Ln
- 1310 Magruder Ct
- 727 Beall Ln
- 709 Beall Ln
- 1312 Heather Ln
- 751 Beall Ln
- 1308 Magruder Ct
- 0 Beall Ln