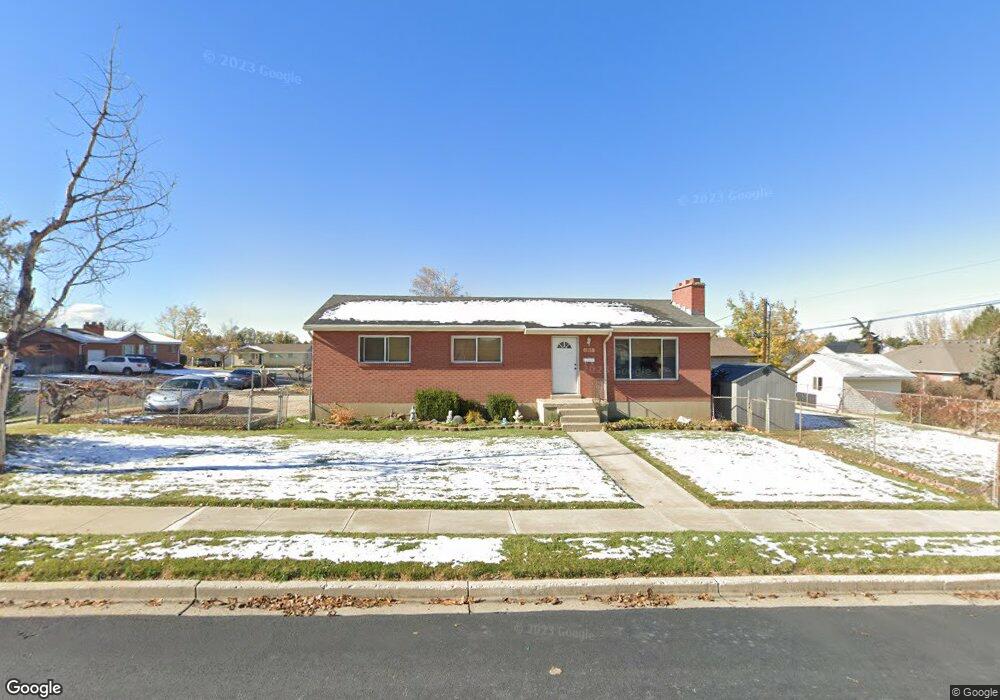
1315 N 250 E Bountiful, UT 84010
Estimated Value: $447,000 - $505,000
5
Beds
1
Bath
1,104
Sq Ft
$433/Sq Ft
Est. Value
About This Home
This home is located at 1315 N 250 E, Bountiful, UT 84010 and is currently estimated at $478,372, approximately $433 per square foot. 1315 N 250 E is a home located in Davis County with nearby schools including Tolman School, Centerville Jr High, and Viewmont High School.
Ownership History
Date
Name
Owned For
Owner Type
Purchase Details
Closed on
Apr 18, 2022
Sold by
Craig Byers
Bought by
Byers Craig and Byers Angela Elvira
Current Estimated Value
Home Financials for this Owner
Home Financials are based on the most recent Mortgage that was taken out on this home.
Original Mortgage
$3,183,150
Outstanding Balance
$2,955,515
Interest Rate
3.85%
Mortgage Type
New Conventional
Estimated Equity
-$2,477,143
Purchase Details
Closed on
Feb 11, 2006
Sold by
Byers Craig and Byers Angela
Bought by
Byers Craig
Home Financials for this Owner
Home Financials are based on the most recent Mortgage that was taken out on this home.
Original Mortgage
$149,000
Interest Rate
7.99%
Mortgage Type
New Conventional
Purchase Details
Closed on
Jul 9, 2002
Sold by
Coleman Kim J and Coleman Tammy L
Bought by
Byers Craig and Byers Angela
Home Financials for this Owner
Home Financials are based on the most recent Mortgage that was taken out on this home.
Original Mortgage
$113,500
Interest Rate
8.6%
Purchase Details
Closed on
Dec 28, 2001
Sold by
Anderson Leroy J
Bought by
Coleman Kim J and Coleman Tammy L
Home Financials for this Owner
Home Financials are based on the most recent Mortgage that was taken out on this home.
Original Mortgage
$99,000
Interest Rate
6.51%
Create a Home Valuation Report for This Property
The Home Valuation Report is an in-depth analysis detailing your home's value as well as a comparison with similar homes in the area
Purchase History
| Date | Buyer | Sale Price | Title Company |
|---|---|---|---|
| Byers Craig | -- | None Listed On Document | |
| Byers Craig | -- | Wasatch Title Ins Agency | |
| Byers Craig | -- | Backman Stewart Title Servic | |
| Coleman Kim J | -- | Backman Stewart Title Servic |
Source: Public Records
Mortgage History
| Date | Status | Borrower | Loan Amount |
|---|---|---|---|
| Open | Byers Craig | $3,183,150 | |
| Previous Owner | Byers Craig | $149,000 | |
| Previous Owner | Byers Craig | $113,500 | |
| Previous Owner | Coleman Kim J | $99,000 |
Source: Public Records
Tax History
| Year | Tax Paid | Tax Assessment Tax Assessment Total Assessment is a certain percentage of the fair market value that is determined by local assessors to be the total taxable value of land and additions on the property. | Land | Improvement |
|---|---|---|---|---|
| 2025 | $2,592 | $233,750 | $119,927 | $113,823 |
| 2024 | $2,442 | $229,350 | $105,498 | $123,852 |
| 2023 | $2,320 | $395,000 | $195,670 | $199,330 |
| 2022 | $2,290 | $213,400 | $107,273 | $106,127 |
| 2021 | $2,059 | $293,000 | $140,324 | $152,676 |
| 2020 | $1,818 | $259,000 | $120,345 | $138,655 |
| 2019 | $1,845 | $257,000 | $130,384 | $126,616 |
| 2018 | $1,691 | $231,000 | $127,883 | $103,117 |
| 2016 | $1,428 | $105,435 | $52,076 | $53,359 |
| 2015 | $1,390 | $96,745 | $52,076 | $44,669 |
| 2014 | $1,441 | $103,843 | $52,076 | $51,767 |
| 2013 | -- | $94,741 | $40,746 | $53,995 |
Source: Public Records
Map
Nearby Homes
- 1420 N Main St
- 967 S Courtyard Ln
- 96 Village Square Rd
- 610 E Pages Ln
- 951 Centerville Commons Way
- 1260 N 200 W
- 16 W 780 S
- 662 E 1200 N
- 1130 N 200 W
- 235 W 1400 N
- 184 Park Shadows Cir
- 106 W 700 N
- 453 N 400 E Unit 7-D
- 345 E 600 S
- 345 N 400 E
- 204 Lyman Ln
- 328 W Pages Ln
- 495 E 475 S
- 563 N 200 W
- 499 N 200 W Unit 30
Your Personal Tour Guide
Ask me questions while you tour the home.