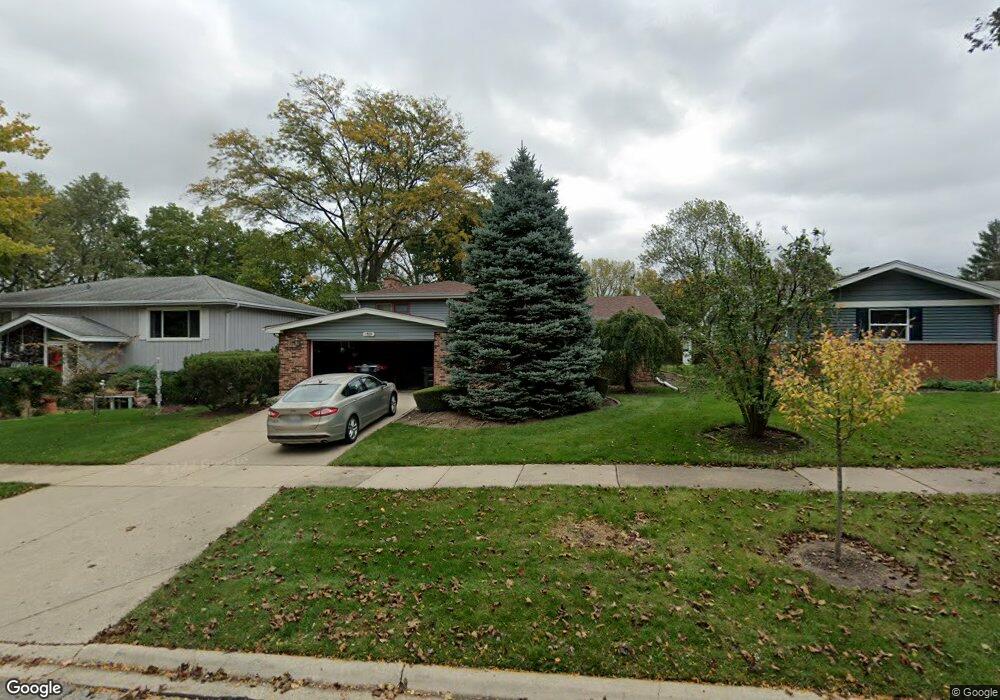
1315 N Chestnut Ave Arlington Heights, IL 60004
Estimated Value: $479,000 - $515,000
3
Beds
2
Baths
1,282
Sq Ft
$388/Sq Ft
Est. Value
About This Home
This home is located at 1315 N Chestnut Ave, Arlington Heights, IL 60004 and is currently estimated at $497,068, approximately $387 per square foot. 1315 N Chestnut Ave is a home located in Cook County with nearby schools including Olive-Mary Stitt Elementary School, Thomas Middle School, and John Hersey High School.
Ownership History
Date
Name
Owned For
Owner Type
Purchase Details
Closed on
Mar 10, 2009
Sold by
Nelson Lanura H
Bought by
Nelson Ernest W
Current Estimated Value
Home Financials for this Owner
Home Financials are based on the most recent Mortgage that was taken out on this home.
Original Mortgage
$570,000
Outstanding Balance
$362,058
Interest Rate
5.11%
Mortgage Type
Reverse Mortgage Home Equity Conversion Mortgage
Estimated Equity
$135,010
Purchase Details
Closed on
Oct 10, 2001
Sold by
Nelson Laura H and Nelson Ernest W
Bought by
Nelson Ernest W and Nelson Laura H
Purchase Details
Closed on
Mar 9, 2001
Sold by
Elliott Lynda J
Bought by
Nelson Laura H
Home Financials for this Owner
Home Financials are based on the most recent Mortgage that was taken out on this home.
Original Mortgage
$150,000
Interest Rate
6.75%
Purchase Details
Closed on
May 10, 1999
Sold by
Elliott John H
Bought by
Elliott Lynda J
Create a Home Valuation Report for This Property
The Home Valuation Report is an in-depth analysis detailing your home's value as well as a comparison with similar homes in the area
Home Values in the Area
Average Home Value in this Area
Purchase History
| Date | Buyer | Sale Price | Title Company |
|---|---|---|---|
| Nelson Ernest W | -- | None Available | |
| Nelson Ernest W | -- | -- | |
| Nelson Laura H | $300,000 | -- | |
| Elliott Lynda J | -- | -- |
Source: Public Records
Mortgage History
| Date | Status | Borrower | Loan Amount |
|---|---|---|---|
| Open | Nelson Ernest W | $570,000 | |
| Closed | Nelson Laura H | $150,000 |
Source: Public Records
Tax History Compared to Growth
Tax History
| Year | Tax Paid | Tax Assessment Tax Assessment Total Assessment is a certain percentage of the fair market value that is determined by local assessors to be the total taxable value of land and additions on the property. | Land | Improvement |
|---|---|---|---|---|
| 2024 | $8,222 | $36,000 | $7,920 | $28,080 |
| 2023 | $7,868 | $36,000 | $7,920 | $28,080 |
| 2022 | $7,868 | $36,000 | $7,920 | $28,080 |
| 2021 | $5,306 | $30,570 | $4,950 | $25,620 |
| 2020 | $4,815 | $30,570 | $4,950 | $25,620 |
| 2019 | $4,766 | $33,967 | $4,950 | $29,017 |
| 2018 | $5,306 | $29,355 | $4,356 | $24,999 |
| 2017 | $9,289 | $32,210 | $4,356 | $27,854 |
| 2016 | $5,654 | $32,210 | $4,356 | $27,854 |
| 2015 | $6,520 | $26,643 | $3,762 | $22,881 |
| 2014 | $7,637 | $26,643 | $3,762 | $22,881 |
| 2013 | $6,185 | $26,643 | $3,762 | $22,881 |
Source: Public Records
Map
Nearby Homes
- 1317 N Mitchell Ave
- 1237 N Ridge Ave
- 1142 N Mitchell Ave
- 1136 N Walnut Ave
- 1123 N Dunton Ave
- 1001 N Dunton Ave
- 924 N Highland Ave
- 910 N Chestnut Ave
- 827 N Walnut Ave
- 1729 N Mitchell Ave
- 1518 N Patton Ave
- 1653 N Belmont Ct Unit 31
- 25 E Palatine Rd Unit 303
- 25 E Palatine Rd Unit 207
- 421 W Hawthorne St
- 815 E Olive St
- 1416 W Lynnwood Ave
- 1670 N Douglas Ct Unit 86
- 703 N Arlington Heights Rd
- 1825 N Kaspar Ave
- 1311 N Chestnut Ave
- 1319 N Chestnut Ave
- 1307 N Chestnut Ave
- 1318 N Highland Ave
- 1322 N Highland Ave
- 1314 N Highland Ave
- 216 W Olive St
- 1308 N Highland Ave
- 1326 N Highland Ave
- 1327 N Chestnut Ave
- 1314 N Chestnut Ave
- 1310 N Chestnut Ave
- 1318 N Chestnut Ave
- 204 W Olive St
- 1332 N Highland Ave
- 1306 N Chestnut Ave
- 1322 N Chestnut Ave
- 1331 N Chestnut Ave
- 306 W Olive St
- 1326 N Chestnut Ave