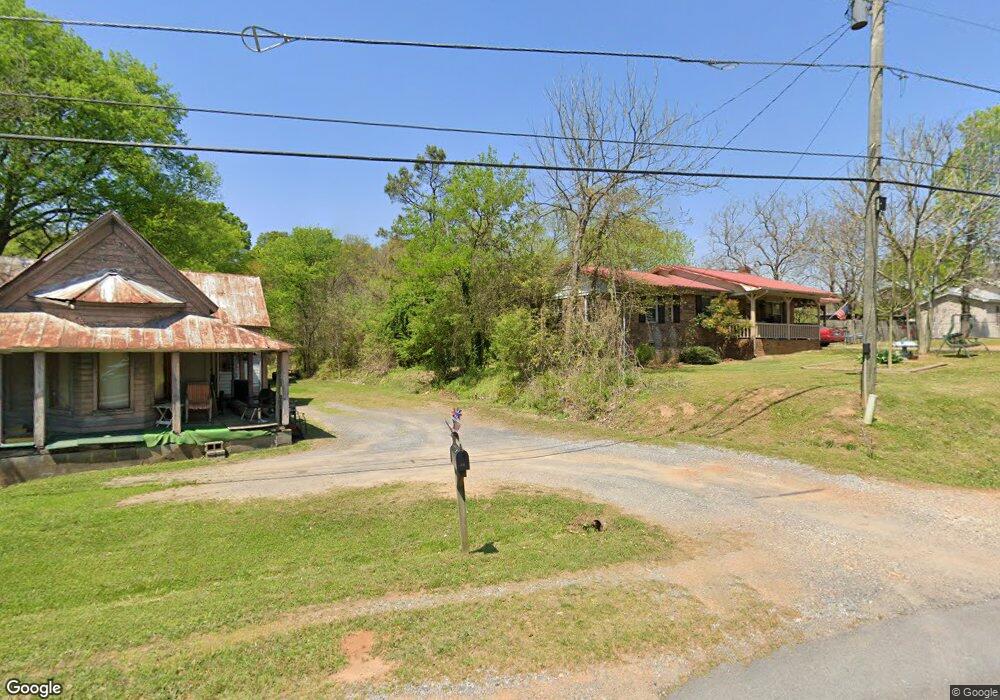
1315 Prospect Rd Rockmart, GA 30153
Estimated Value: $114,509 - $295,000
2
Beds
1
Bath
1,001
Sq Ft
$195/Sq Ft
Est. Value
About This Home
This home is located at 1315 Prospect Rd, Rockmart, GA 30153 and is currently estimated at $195,127, approximately $194 per square foot. 1315 Prospect Rd is a home located in Polk County with nearby schools including Rockmart Middle School.
Ownership History
Date
Name
Owned For
Owner Type
Purchase Details
Closed on
Aug 12, 1999
Sold by
Davenport Diane Lee
Bought by
Davenport Jackie Eugene
Current Estimated Value
Purchase Details
Closed on
May 17, 1990
Sold by
Fleet Finance Inc Ga
Bought by
Davenport Jackie E
Purchase Details
Closed on
Oct 10, 1989
Sold by
Medlock Billy
Bought by
Fleet Finance Inc
Purchase Details
Closed on
Oct 27, 1986
Sold by
Brock Nela Cook
Bought by
Medlock Regina L
Purchase Details
Closed on
May 27, 1982
Sold by
Brock Brock H and Brock Nela C
Bought by
Brock Nela Cook
Purchase Details
Closed on
Nov 5, 1976
Sold by
Alexander Vernon M
Bought by
Brock Brock H and Brock Nela C
Purchase Details
Closed on
May 26, 1971
Sold by
Carter Jerry Lee
Bought by
Alexander Vernon M
Purchase Details
Closed on
Jun 27, 1970
Sold by
Knight Robert R
Bought by
Carter Jerry Lee
Purchase Details
Closed on
Feb 22, 1968
Sold by
Whiteside W E Mrs
Bought by
Knight Robert R
Purchase Details
Closed on
Jan 1, 1901
Bought by
Whiteside W E Mrs
Create a Home Valuation Report for This Property
The Home Valuation Report is an in-depth analysis detailing your home's value as well as a comparison with similar homes in the area
Purchase History
| Date | Buyer | Sale Price | Title Company |
|---|---|---|---|
| Davenport Jackie Eugene | -- | -- | |
| Davenport Jackie E | $33,900 | -- | |
| Fleet Finance Inc | $43,000 | -- | |
| Medlock Regina L | -- | -- | |
| Brock Nela Cook | -- | -- | |
| Brock Brock H | -- | -- | |
| Alexander Vernon M | -- | -- | |
| Carter Jerry Lee | -- | -- | |
| Knight Robert R | -- | -- | |
| Whiteside W E Mrs | -- | -- |
Source: Public Records
Tax History
| Year | Tax Paid | Tax Assessment Tax Assessment Total Assessment is a certain percentage of the fair market value that is determined by local assessors to be the total taxable value of land and additions on the property. | Land | Improvement |
|---|---|---|---|---|
| 2025 | $332 | $20,124 | $4,670 | $15,454 |
| 2024 | $332 | $17,892 | $3,434 | $14,458 |
| 2023 | $270 | $13,388 | $3,434 | $9,954 |
| 2022 | $216 | $11,113 | $2,289 | $8,824 |
| 2021 | $219 | $11,113 | $2,289 | $8,824 |
| 2020 | $220 | $11,113 | $2,289 | $8,824 |
| 2019 | $569 | $23,195 | $2,289 | $20,906 |
| 2018 | $528 | $21,159 | $2,289 | $18,870 |
| 2017 | $521 | $21,159 | $2,289 | $18,870 |
| 2016 | $539 | $21,796 | $2,925 | $18,870 |
| 2015 | $548 | $22,068 | $2,925 | $19,142 |
| 2014 | $552 | $22,068 | $2,925 | $19,142 |
Source: Public Records
Map
Nearby Homes
- 133 N Bellview Rd
- 1638 Prospect Rd
- 0 Rome Hwy 101 Unit 7513391
- 0 Rome Hwy 101 Unit 25352772
- 0 Rome Hwy 101 Unit 10445422
- 14 Aragon Rd
- 65 Long Station Rd
- 66 Elm St
- 58 Elm St
- 15 Aragon Rd
- 100 Hixville Rd
- 95 Cashtown Rd
- 19 Williams St
- 30 N Oak St
- 0000 Flint Hill Rd
- 11 Magnolia St
- 1 E 4th St
- 0 Portland Rd Unit 10669909
- 0 Portland Rd Unit 7701690
- 2300 Frettiesburg Dr
- 1305 Prospect Rd
- 1325 Prospect Rd
- 1306 Prospect Rd
- 1322 Prospect Rd
- 1335 Prospect Rd
- 1271 Prospect Rd
- 0 Lowery Rd
- 1334 Prospect Rd
- 1356 Prospect Rd
- 1346 Prospect Rd
- 8 Lowery Rd
- 68 Lowery Rd
- 1292 Prospect Rd
- 1665 Prospect Rd
- 48 Lowery Rd
- 41 Tillery Rd
- 1370 Prospect Rd
- 55 Tillery Rd
- 0 Prospect Rd
- 0 Prospect Rd Unit 10272348