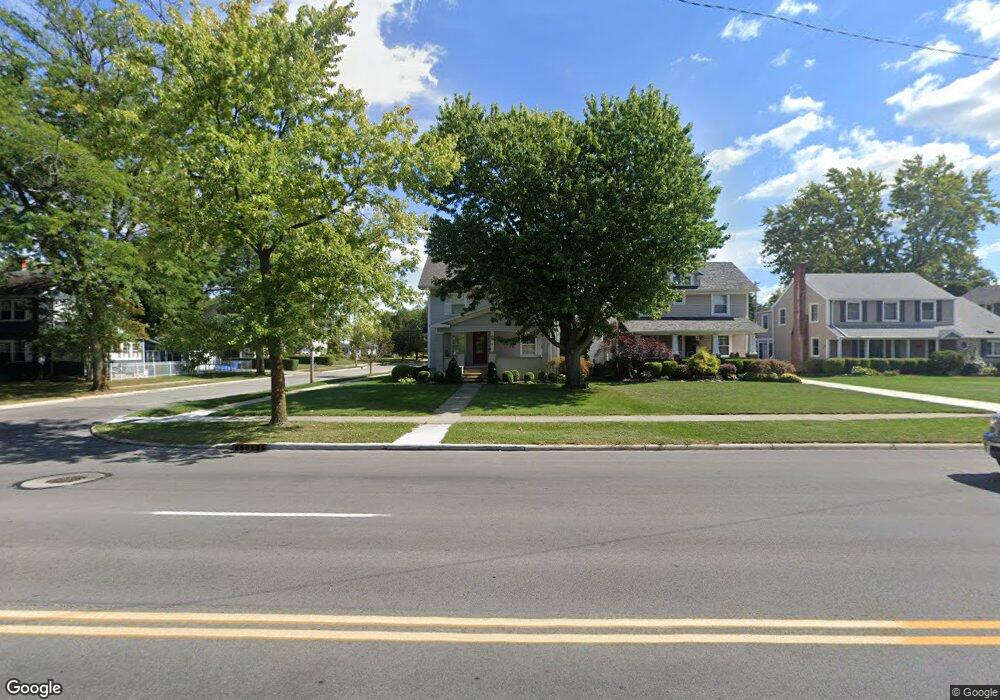
1315 S Main St Findlay, OH 45840
Estimated Value: $301,994 - $424,000
4
Beds
2
Baths
2,074
Sq Ft
$171/Sq Ft
Est. Value
About This Home
This home is located at 1315 S Main St, Findlay, OH 45840 and is currently estimated at $355,249, approximately $171 per square foot. 1315 S Main St is a home located in Hancock County with nearby schools including Jefferson Elementary School, Chamberlin Hill Elementary School, and Donnell Middle School.
Ownership History
Date
Name
Owned For
Owner Type
Purchase Details
Closed on
Nov 27, 2024
Sold by
Coover Daniel A and Coover Sonya K
Bought by
Daniel A Coover And Sonya K Coover Family Tru and Coover
Current Estimated Value
Purchase Details
Closed on
Jun 6, 1994
Sold by
Bemis Daniel
Bought by
Coover Daniel and Coover Sonya
Home Financials for this Owner
Home Financials are based on the most recent Mortgage that was taken out on this home.
Original Mortgage
$100,000
Interest Rate
8.48%
Mortgage Type
New Conventional
Purchase Details
Closed on
Jan 3, 1994
Bought by
Bemis Daniel J and Bemis Kim S
Purchase Details
Closed on
Jul 2, 1993
Bought by
Strong Robert L and Strong Jeannine
Purchase Details
Closed on
Sep 6, 1991
Bought by
Pelletier David B
Purchase Details
Closed on
Aug 21, 1987
Bought by
Leeke Calvin L and Leeke Helen L
Purchase Details
Closed on
Oct 23, 1984
Bought by
Dudley Ruth C
Create a Home Valuation Report for This Property
The Home Valuation Report is an in-depth analysis detailing your home's value as well as a comparison with similar homes in the area
Home Values in the Area
Average Home Value in this Area
Purchase History
| Date | Buyer | Sale Price | Title Company |
|---|---|---|---|
| Daniel A Coover And Sonya K Coover Family Tru | -- | None Listed On Document | |
| Daniel A Coover And Sonya K Coover Family Tru | -- | None Listed On Document | |
| Coover Daniel | $167,900 | -- | |
| Bemis Daniel J | $165,000 | -- | |
| Strong Robert L | $163,500 | -- | |
| Pelletier David B | $128,400 | -- | |
| Leeke Calvin L | $78,500 | -- | |
| Dudley Ruth C | -- | -- |
Source: Public Records
Mortgage History
| Date | Status | Borrower | Loan Amount |
|---|---|---|---|
| Previous Owner | Coover Daniel | $100,000 |
Source: Public Records
Tax History
| Year | Tax Paid | Tax Assessment Tax Assessment Total Assessment is a certain percentage of the fair market value that is determined by local assessors to be the total taxable value of land and additions on the property. | Land | Improvement |
|---|---|---|---|---|
| 2024 | $3,215 | $90,510 | $10,080 | $80,430 |
| 2023 | $3,220 | $90,510 | $10,080 | $80,430 |
| 2022 | $3,209 | $90,510 | $10,080 | $80,430 |
| 2021 | $3,175 | $78,000 | $10,080 | $67,920 |
| 2020 | $3,174 | $78,000 | $10,080 | $67,920 |
| 2019 | $3,110 | $78,000 | $10,080 | $67,920 |
| 2018 | $2,761 | $63,480 | $6,720 | $56,760 |
| 2017 | $1,380 | $63,480 | $6,720 | $56,760 |
| 2016 | $2,716 | $63,480 | $6,720 | $56,760 |
| 2015 | $2,371 | $54,230 | $6,720 | $47,510 |
| 2014 | $2,372 | $54,230 | $6,720 | $47,510 |
| 2012 | $2,199 | $49,910 | $6,720 | $43,190 |
Source: Public Records
Map
Nearby Homes
- 1317 S Main St
- 1319 S Main St
- 1311 S Main St
- 119 Greenlawn Ave
- 116 Greenlawn Ave
- 1321 S Main St
- 1309 S Main St
- 123 Greenlawn Ave
- 1329 S Main St
- 118 Greenlawn Ave
- 1307 S Main St
- 127 Greenlawn Ave
- 120 Greenlawn Ave
- 120 E Mcpherson Ave
- 1333 S Main St
- 1305 S Main St
- 1305 S Main St
- 1305 S Main St
- 128 Greenlawn Ave
- 1314 S Main St
Your Personal Tour Guide
Ask me questions while you tour the home.