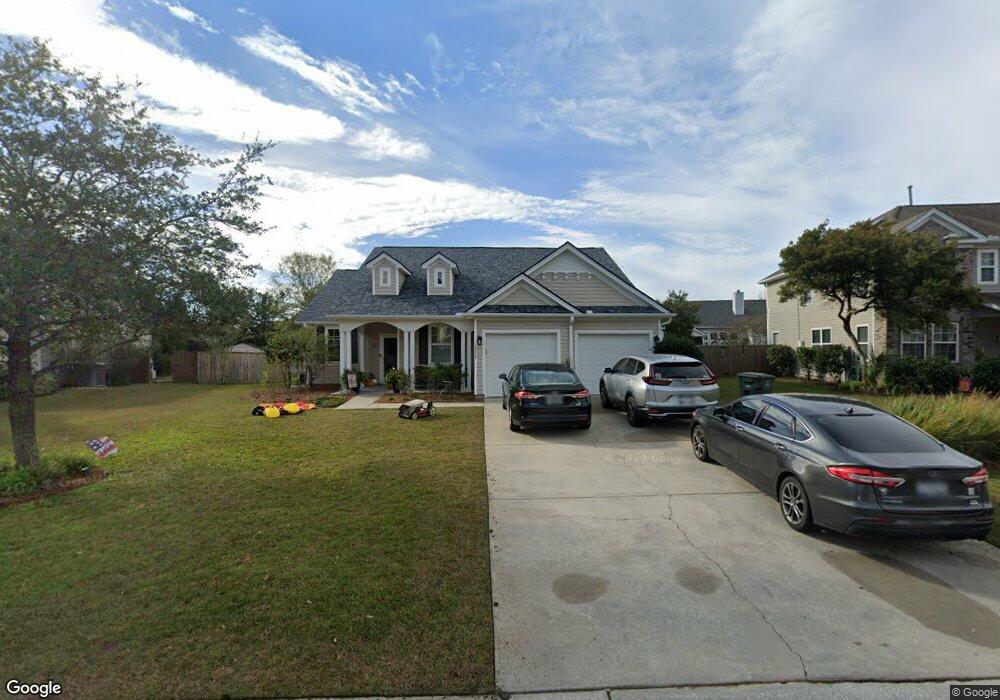
1315 Song Sparrow Way Hanahan, SC 29410
Estimated Value: $441,000 - $504,000
--
Bed
--
Bath
1,959
Sq Ft
$238/Sq Ft
Est. Value
About This Home
This home is located at 1315 Song Sparrow Way, Hanahan, SC 29410 and is currently estimated at $466,404, approximately $238 per square foot. 1315 Song Sparrow Way is a home located in Berkeley County with nearby schools including Bowen's Corner Elementary, Hanahan Middle School, and Hanahan High School.
Ownership History
Date
Name
Owned For
Owner Type
Purchase Details
Closed on
Jul 9, 2018
Sold by
Nicodin Nathan F and Nicodin Elizabeth D
Bought by
Nicodin Elizabeth D
Current Estimated Value
Home Financials for this Owner
Home Financials are based on the most recent Mortgage that was taken out on this home.
Original Mortgage
$200,000
Outstanding Balance
$173,330
Interest Rate
4.5%
Mortgage Type
New Conventional
Estimated Equity
$293,074
Purchase Details
Closed on
Aug 11, 2006
Sold by
Kb Home South Carolina Llc
Bought by
Nicodin Nathan F and Nicodin Elizabeth D
Home Financials for this Owner
Home Financials are based on the most recent Mortgage that was taken out on this home.
Original Mortgage
$175,000
Interest Rate
6.67%
Mortgage Type
Future Advance Clause Open End Mortgage
Purchase Details
Closed on
Mar 11, 2006
Sold by
Charleston Brown Co Llc
Bought by
Kb Home South Carolina Llc
Create a Home Valuation Report for This Property
The Home Valuation Report is an in-depth analysis detailing your home's value as well as a comparison with similar homes in the area
Home Values in the Area
Average Home Value in this Area
Purchase History
| Date | Buyer | Sale Price | Title Company |
|---|---|---|---|
| Nicodin Elizabeth D | -- | None Available | |
| Nicodin Nathan F | $225,682 | None Available | |
| Kb Home South Carolina Llc | $421,225 | None Available |
Source: Public Records
Mortgage History
| Date | Status | Borrower | Loan Amount |
|---|---|---|---|
| Open | Nicodin Elizabeth D | $200,000 | |
| Closed | Nicodin Nathan F | $175,000 |
Source: Public Records
Tax History Compared to Growth
Tax History
| Year | Tax Paid | Tax Assessment Tax Assessment Total Assessment is a certain percentage of the fair market value that is determined by local assessors to be the total taxable value of land and additions on the property. | Land | Improvement |
|---|---|---|---|---|
| 2025 | $1,505 | $266,962 | $54,220 | $212,742 |
| 2024 | $1,505 | $10,679 | $2,169 | $8,510 |
| 2023 | $1,505 | $10,679 | $2,169 | $8,510 |
| 2022 | $1,416 | $8,938 | $1,697 | $7,241 |
| 2021 | $1,334 | $8,940 | $1,697 | $7,241 |
| 2020 | $1,256 | $8,938 | $1,697 | $7,241 |
| 2019 | $4,132 | $8,938 | $1,697 | $7,241 |
| 2018 | $1,200 | $7,772 | $1,920 | $5,852 |
| 2017 | $1,175 | $7,772 | $1,920 | $5,852 |
| 2016 | $1,195 | $7,770 | $1,920 | $5,850 |
| 2015 | $1,051 | $7,770 | $1,920 | $5,850 |
| 2014 | $1,028 | $7,770 | $1,920 | $5,850 |
| 2013 | -- | $7,770 | $1,920 | $5,850 |
Source: Public Records
Map
Nearby Homes
- 7326 Kestrel Trail
- 1333 Song Sparrow Way
- 7402 Purser Ln
- 7317 Horned Grebe Ct
- 7434 Northgate Dr
- 7303 Kestrel Trail
- 7304 Kestrel Trail
- 7406 Mercedes Way
- 7316 Water Thrush Ct
- 7358 Suncatcher Dr
- 7316 Stoney Moss Way
- 1038 Old Cypress Run
- 7532 Hawks Cir
- 202 Waterwood Dr Unit 2302
- 605 Waterwood Dr Unit 1505
- 607 Waterwood Dr
- 7217 Mossy Creek Ln
- 201 Greenmeadow Dr
- 202 Greenmeadow Dr
- 1005 Waterwood Dr
- 1313 Song Sparrow Way
- 1317 Song Sparrow Way
- 7328 Kestrel Trail
- 7324 Kestrel Trail
- 1319 Song Sparrow Way
- 1311 Song Sparrow Way
- 1312 Song Sparrow Way
- 7330 Kestrel Trail
- 1314 Song Sparrow Way
- 7337 Brown Thrasher Ct
- 1310 Song Sparrow Way
- 1321 Song Sparrow Way
- 7322 Kestrel Trail
- 7332 Kestrel Trail
- 7336 Brown Thrasher Ct
- 1316 Song Sparrow Way
- 1308 Song Sparrow Way
- 7323 Kestrel Trail
- 1323 Song Sparrow Way
- 7335 Brown Thrasher Ct